- PitchDeckGuy
- Posts
- Prologis' Investment Strategy
Prologis' Investment Strategy
Niko From Collateral
January 24, 2025

Hello PitchDeckGuy readers!
In this week's analysis, we examine how Prologis, the global leader in logistics real estate, has positioned itself at the intersection of commerce transformation and real estate infrastructure, managing an extraordinary $218 billion in assets across four continents.
First, we'll explore how Prologis evolved from a traditional industrial REIT into a comprehensive logistics solutions provider, integrating cutting-edge technology, sustainable practices, and innovative customer offerings that extend far beyond basic warehouse space.
Then, we'll analyze their November 2024 investor presentation, which reveals how their scale and market positioning have created a self-sustaining ecosystem where development expertise, customer relationships, and capital deployment capabilities reinforce each other.
The market landscape they navigate showcases the critical role of logistics real estate in modern commerce, as companies increasingly prioritize supply chain resilience, last-mile delivery capabilities, and technological integration in their distribution networks.
Finally, we'll explain why this presentation is so effective - and how their deck positions them as an essential partner in global commerce while highlighting the strategic advantages that make them unique in their space.
Context and Market Environment
As Prologis presents its investment case in 2024, it validates a thesis formed over decades:
That logistics real estate would become the critical infrastructure underlying modern commerce.
The scope of this transformation is tough to deny. Their platform now encompasses 1.2 billion square feet across 20 countries, serving over 6,700 customers ranging from e-commerce giants to local distributors.
In the past, warehouses were viewed simply as cost centers - places to store inventory between production and sale.
Today, they are assets that enable competitive advantages in speed, efficiency, and customer service.
This shift has been particularly dramatic in regard to e-commerce.
What began as a minor influence on warehouse demand has evolved into a heavyweight transformative force, with online retail requiring approximately three times more logistics space per dollar of sales compared to traditional retail models.
Several powerful dynamics are at play here:
The rise of supply chain resilience as a strategic priority has driven demand for more sophisticated distribution networks with greater redundancy and flexibility. The lessons learned during recent supply chain disruptions have only accelerated this trend.
Almost anyone can personally validate this thesis – by simply speaking to someone who owns an e-commerce business.
As a result, the intensifying competition for prime logistics locations, particularly in dense urban markets, has created significant barriers to entry.
Replacement costs have risen dramatically, with construction costs reaching $216 per square foot and continuing to climb.
A structural shift in how corporations view logistics real estate, from a pure cost consideration to a critical enabler of business strategy, has transformed the landlord-tenant relationship.
This is evidenced by the fact that rent, typically representing only 3-6% of total supply chain costs, is increasingly viewed in the context of the broader operational value it enables.
Prologis's evolution within this landscape illustrates their depth of foresight and operational excellence.
Their early recognition of these trends led them to build an irreplaceable portfolio of logistics assets in key consumption markets, complemented by a development platform capable of delivering modern facilities at scale.
The results speak to the power of their approach:
Consistent operational outperformance, an industry-leading development track record with $46.8 billion invested since 2001, and the successful scaling of innovative offerings like rooftop solar installations and their Essential Operations platform.
Against this backdrop, Prologis's investor presentation demonstrates how their integrated platform can create extraordinary value during a period of sustained logistics transformation.
The foundation is laid - now let's examine their deck.
The Power of (Simple) Sophistication
Prologis opens their pitch with a masterclass in visual storytelling that accomplishes something far easier said than done:
Making the complex appear inevitable.
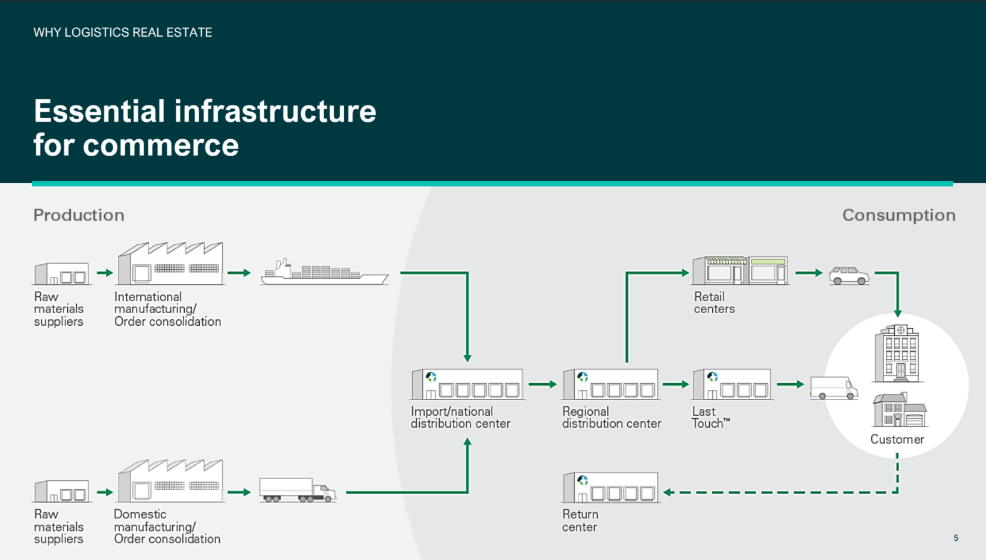
We see what appears to be a straightforward supply chain diagram.
But the actual effect is profound:
One slide packages Prologis's entire business thesis into a single, compelling visual narrative.
This positions Prologis's facilities as the critical connective tissue of modern commerce.
By showing multiple entry points (international and domestic manufacturing) converging into their logistics network before branching out to various consumption channels, the visualization subtly communicates several key messages:
First, it demonstrates how Prologis properties serve as essential nodes in both global and domestic supply chains, emphasizing their importance regardless of trade patterns or manufacturing locations.
Second, the prominent inclusion of the "Return Center" with its dotted line back to the network presciently acknowledges the growing importance of reverse logistics in e-commerce - a sophisticated detail that speaks to Prologis's deep understanding of evolving market dynamics.
Third, and perhaps most importantly, it positions their real estate not as passive storage space, but as active infrastructure enabling the flow of commerce.
This subtle repositioning elevates their entire value proposition from that of a traditional real estate company to an essential service provider.
Next, they start delivering evidence:
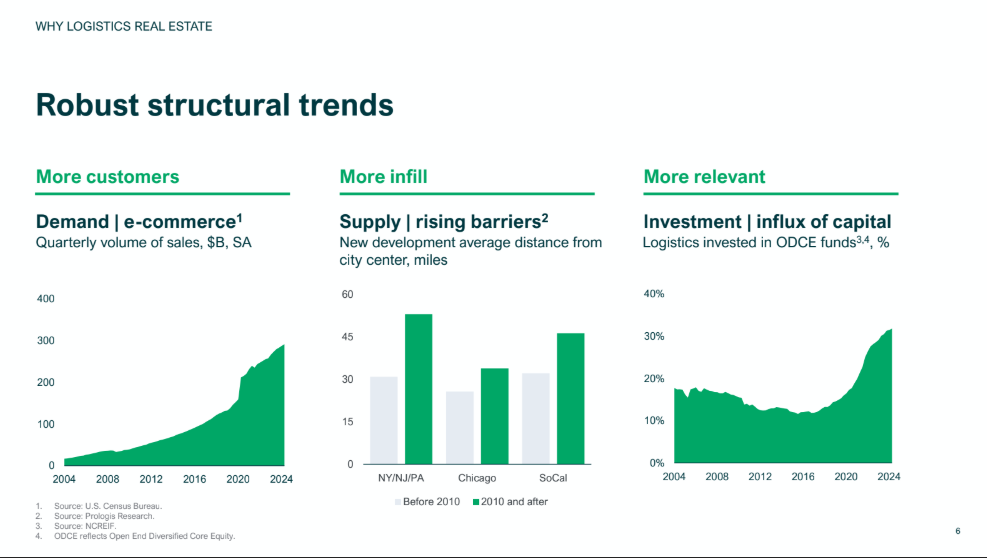
The visual organization here employs a powerful "more" framework - More Customers, More Infill, More Relevant. This effectively transforms rather complex market dynamics into a clear, progressive narrative.
In particular, the recent sharp uptick in allocation percentages suggests a structural shift in how the investment community views logistics real estate.
This slide progressively builds conviction:
From market demand (e-commerce) to physical constraints (development barriers) to institutional recognition (fund allocation).
Each piece of evidence reinforces the others, building a case for both the sector and Prologis's position within it.
Prologis's third slide jumps into the mix with one goal:
Transform potential market volatility from a risk into a strength.
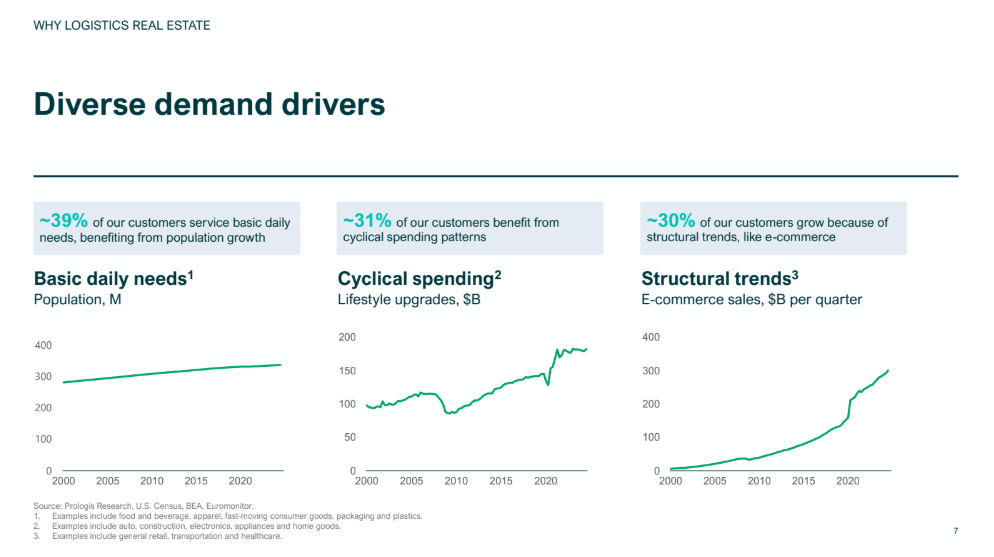
We see their customer base broken into three distinct demand categories, each with its own growth trajectory. The message here is clear:
“This operation is resilient.”
Each category serves a specific purpose in the investment thesis:
“Basic daily needs” anchors the portfolio to characteristics sought out by institutional investors seeking core real estate exposure.
“Cyclical spending” demonstrates Prologis's ability to capture economic upside. The graph's recovery pattern through past market cycles illustrates both the cyclical nature of this segment and its consistent return to growth - a subtle nod to the portfolio's resilient bent.
“Structural trends” highlights pure growth potential through e-commerce adoption.
This three-part structure transforms what could have been a simple customer breakdown into evidence of sophisticated portfolio construction.
Stability, economic participation, and secular growth.
The fourth slide builds on this foundation by diving deep into their largest growth driver: e-commerce.
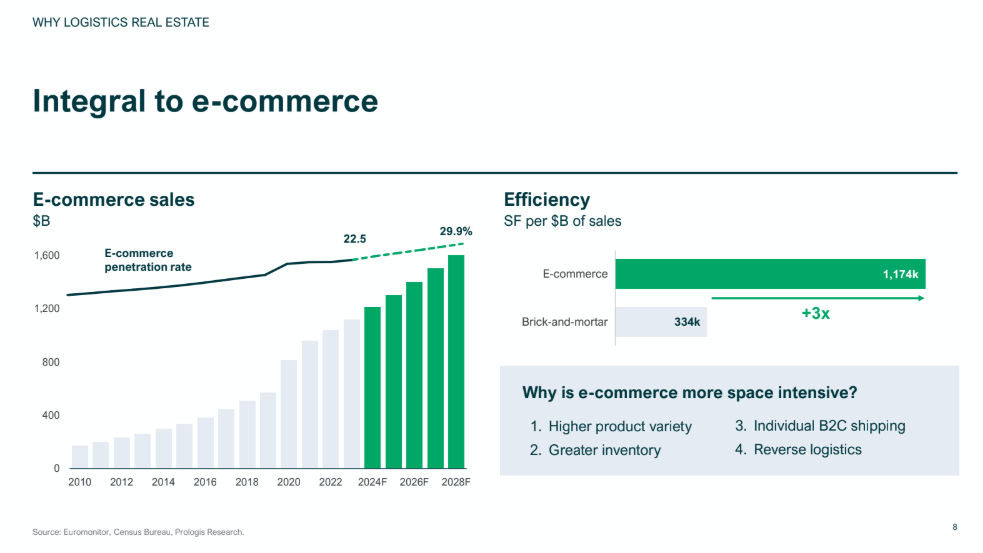
Here, Prologis quantifies both the scale and durability of this opportunity.
The left side presents e-commerce growth through dual metrics:
Absolute sales volume and penetration rate. This combo proves the opportunity's magnitude while simultaneously demonstrating significant remaining upside.
The green bars transitioning from historical data to forecasts create visual continuity between proven growth and future potential.
The right side delivers the key insight:
E-commerce requires 3x more logistics space per dollar of sales compared to traditional retail.
This simple metric transforms the e-commerce growth story into direct real estate demand. The stark visual contrast between e-commerce (1,174k SF) and brick-and-mortar (334k SF) space requirements makes the mathematical relationship immediately clear.
The bottom section explains why this 3x multiple exists through four concise bullet points. Each factor - product variety, inventory depth, B2C shipping, and reverse logistics - represents a structural change in retail operations that demands additional space.
By listing these factors without extensive explanation, Prologis demonstrates confidence in their analysis while keeping focus on the core metric.
This progression from macro to micro factors speaks to both immediate opportunities and long-term value creation.
At this point in the presentation, you can feel momentum.
The next slide demolishes the traditional view of rent as a pure cost center with devastating economic precision:
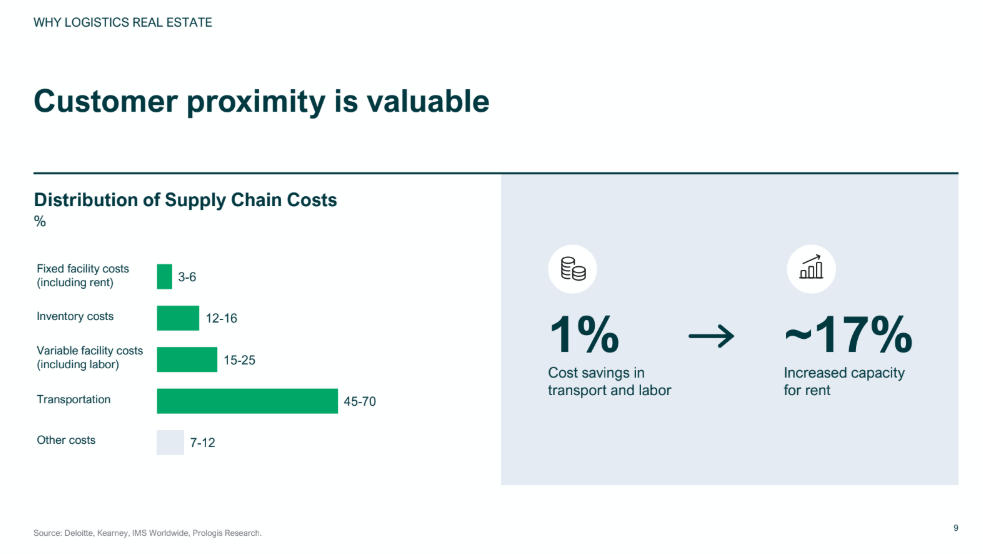
Prologis executes a brilliant pivot here: they transform the conversation from "How much does the space cost?" to "How much value does the location create?"
The left-side bar chart serves up a reality check that many real estate presentations miss: rent represents just 3-6% of total supply chain costs. Then, they show how that seemingly small slice of the cost pie can drive massive savings elsewhere in the system.
The right side of the slide serves up reinforcement:
A 1% reduction in transport and labor costs translates into capacity for a 17% increase in rent.
Simple. Clean. Highly effective.
If the proximity slide reframes the value proposition, the "Escalating Cost" slide drives home why this matters right now.
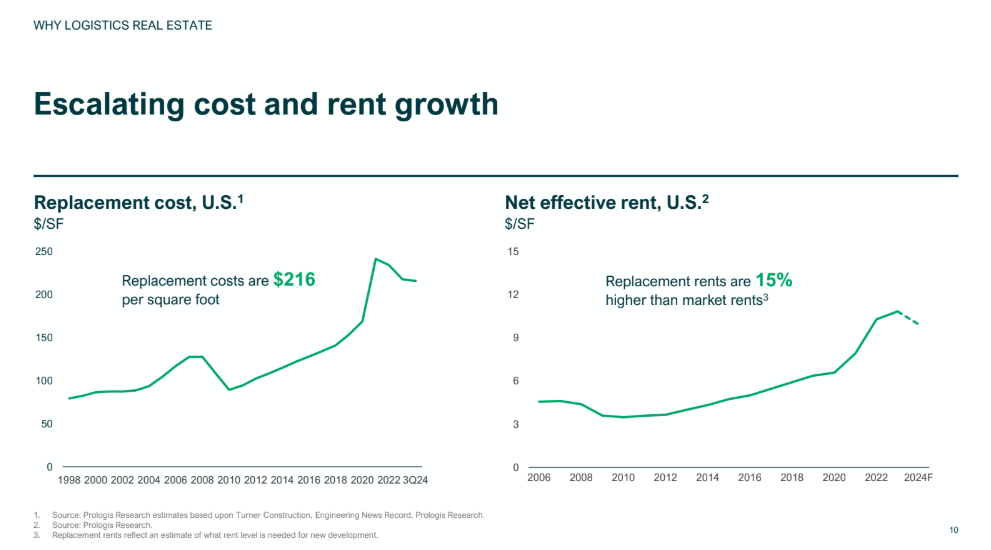
These twin graphs tell a story of economic forces creating an ever-widening moat around Prologis's existing portfolio.
The left graph tracks replacement costs skyrocketing to $216 per square foot - a number that would have seemed impossible just a few years ago - while the right-side graph shows that net effective rents now sit 15% above market rates.
Translation:
New supply can't compete with existing rents, creating a pricing umbrella that protects - and will likely expand - Prologis's current rental rates.
The time scales chosen for these graphs (1998-2024 and 2006-2024) serve a deliberate purpose. They demonstrate that while costs have always trended upward…but the recent acceleration represents something different:
A structural shift in the economics of new supply.
This isn't just about real estate fundamentals anymore.
It's about the mathematics of competitive advantage in modern logistics.
And those mathematics all point toward the value of existing, well-located logistics real estate appreciating faster than the broader market can build new supply.
Next, Prologis opens the "Why Prologis" section with numbers that scream dominance:
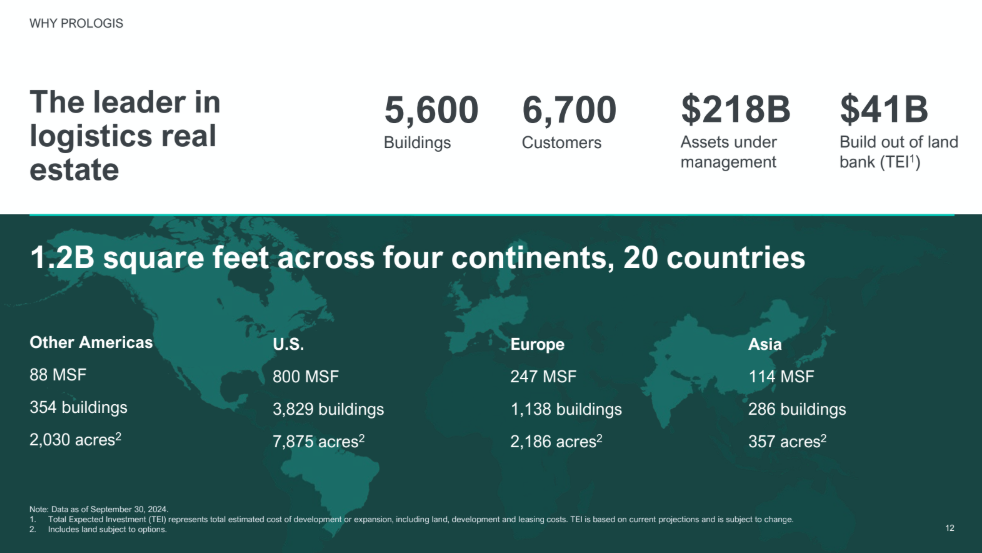
The slide's stark presentation of their portfolio statistics doesn’t mince words:
“Here’s proof we’re winning.”
The world map, however, reinforces that this isn't just about size - it's about positioning.
The U.S. concentration doles out stable core earnings, while the international exposure offers growth runways in developing markets.
Next, we see a simple capabilities overview turned into a growth roadmap:
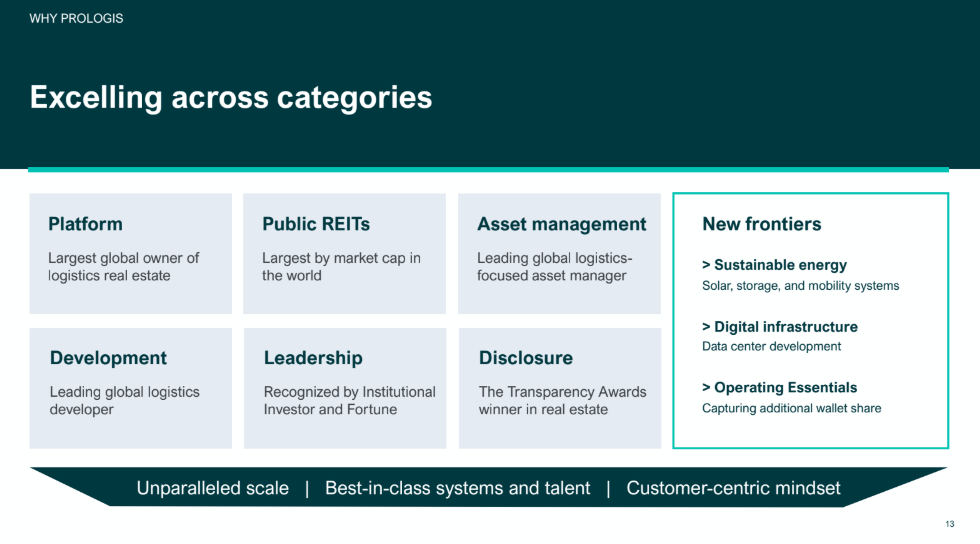
Each category builds on the last, creating a virtuous cycle of competitive advantages.
The left side establishes dominance in traditional metrics:
Largest platform, biggest REIT, top asset manager.
Then, the items in the "New Frontiers" box gracefully illustrate their core thesis:
They represent Prologis weaponizing their scale to capture value chains their competitors can't even access.
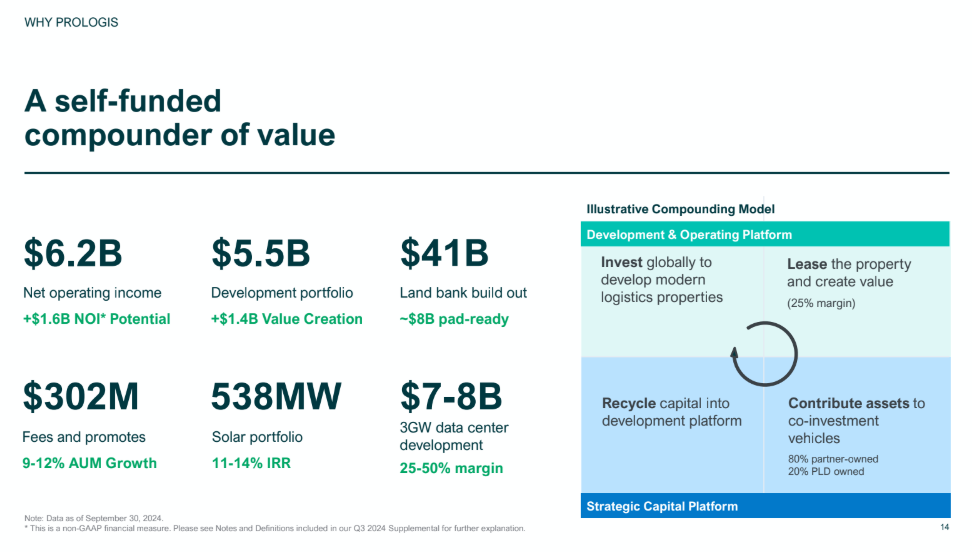
The next slide proves they've built a perpetual motion machine for value creation.
Real quick...
Your market opportunity deserves an institutional-quality presentation. BetterPitch has created over 316 successful pitches across 17 industries, and we've earned a 96/100 client satisfaction rating along the way. Let us help you craft a pitch that captures your opportunity
The right-side diagram shows how development profits fuel new projects while co-investment vehicles provide capital efficiency.
But the numbers on the left reinforce the core notion of the past few slides:
They're not just playing in this space - they aim to dominate it.
This three-slide sequence transforms Prologis from a simple real estate company into something far more valuable:
An integrated logistics platform that generates its own growth opportunities…with iron-clad competitive advantages.
They're not just winning the game - they're changing the rules entirely.
The foundation is built. The machine is running. And the numbers suggest this is just the beginning of what Prologis can accomplish with this platform.
Next, they drop a heat map to further cement their behemoth market positioning:
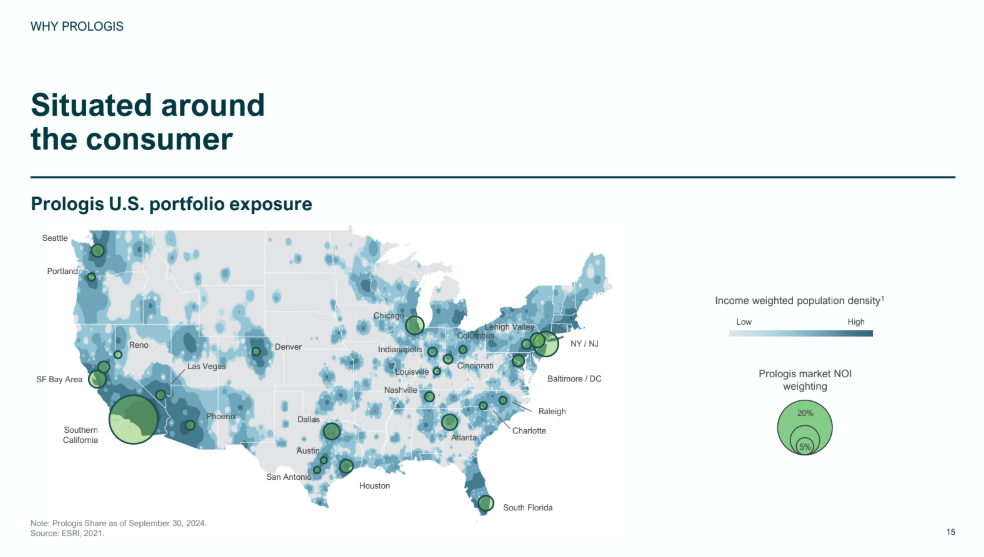
By overlaying income-weighted population density with their facility locations, Prologis demonstrates how they've locked up the most valuable logistics nodes in North America.
The clustering patterns tell a clear story:
Dense concentrations in Southern California, the NY/NJ corridor, and other high-barrier coastal markets dominate the landscape.
The green circles showing NOI weighting reinforce the value - Prologis has built its heaviest positions in markets where new development faces the steepest barriers to entry.
This map serves as a visual representation of decades of strategic positioning coming to fruition.
The blue patches of population density represent permanent demand drivers, perfectly aligned with Prologis's irreplaceable locations serving them.
Then, the "fortress balance sheet" slide delivers hard numbers that would make any risk officer smile:
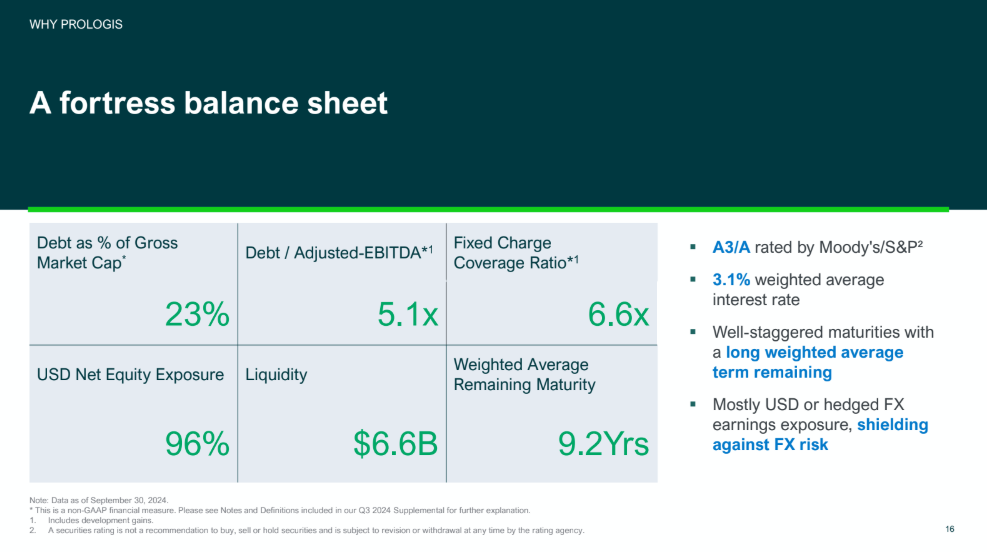
Here we see significant defensive positioning and hard numbers that reinforce their rock-solid stability.
The perfect primer for the customer breadth slide, which highlights their masterful portfolio construction:
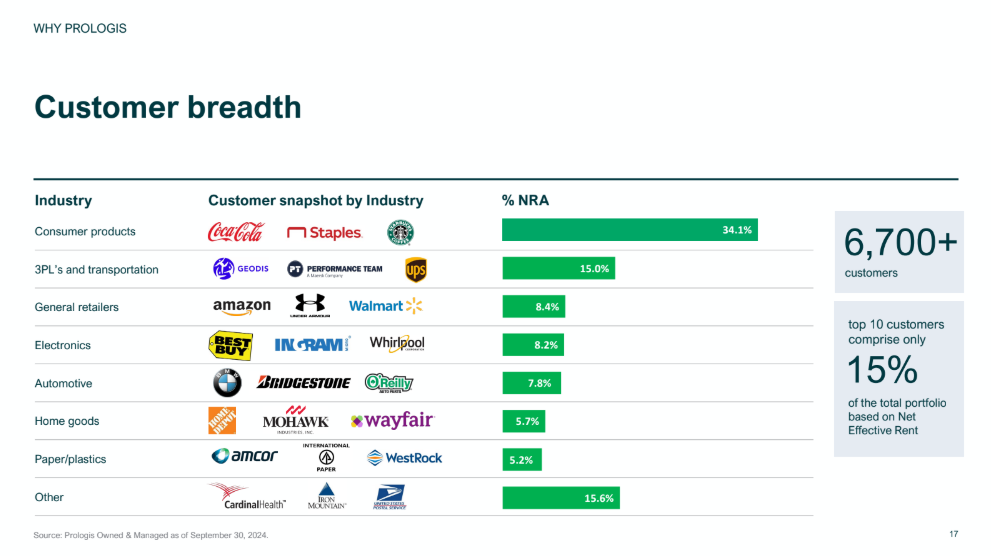
The assembled logos represent the upper echelon of global corporate credit quality and well-positioned industry diversification. And they communicate a profound strategic foresight:
Prologis has engineered their tenant mix to create natural hedges across economic cycles.
Consumer products form the foundation, providing stability through recessions. This combines with logistics companies riding secular growth trends and retailers leading the e-commerce revolution.
The specialized sector allocations demonstrate disciplined risk management through careful exposure limits.
And the single-digit concentration among top tenants transforms a traditional portfolio risk into a tangible strength.
Even the largest global customers operate under natural portfolio limits, ensuring Prologis maintains negotiating leverage while benefiting from blue-chip credit quality.
The next slide aims to rewrite the relationship between landlord and tenant:
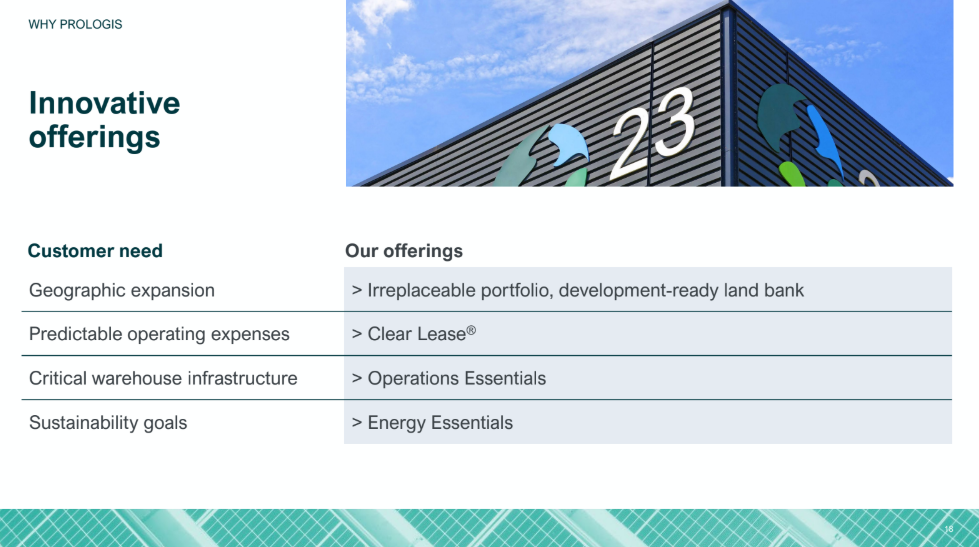
By presenting Clear Lease® as the answer to predictable operating expenses, Prologis again positions itself as a problem-solver rather than a cost center.
They've productized what should be a basic service function.
This transforms rent from an expense to be minimized into a useful tool for operational clarity.
Operations Essentials and Energy Essentials complete this sleight of hand:
Prologis moves seamlessly from providing “four walls and a roof” into delivering mission-critical infrastructure that tenants can't easily replace.
The "Future-proofing" visualization maps out Prologis's takeover of the tenant's operational infrastructure:
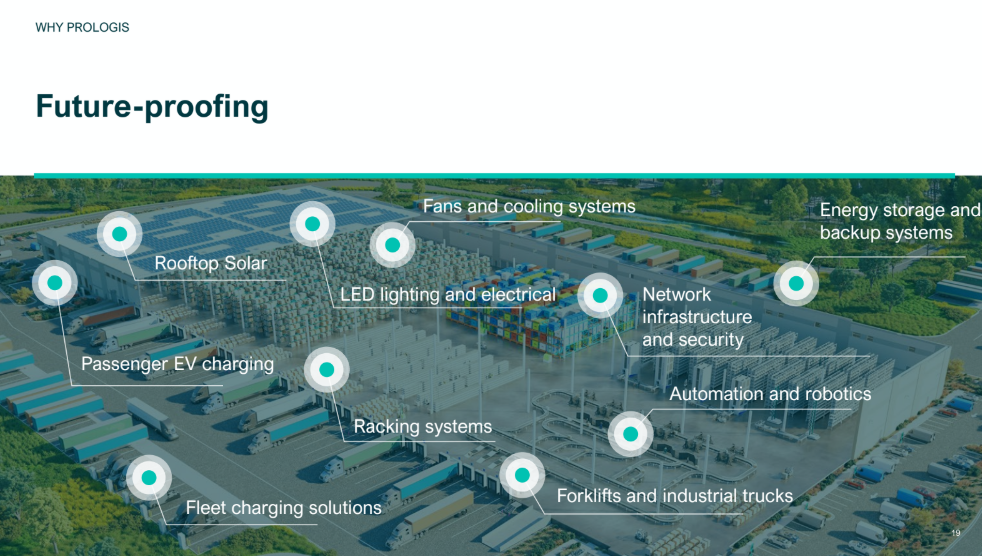
Every dot on the image represents a future revenue stream and a deepening of tenant dependence on Prologis's ecosystem.
Consider the progression:
From basic needs like LED lighting to sophisticated automation infrastructure. From simple EV charging to comprehensive energy management solutions.
Each element builds upon the others, creating an integrated platform that tenants will find increasingly difficult to replicate elsewhere.
The development track record slide appears to be about numbers, but it's really about narrative control.
And the 33.5% margin in the U.S. market sends a clear message to investors:
Prologis doesn't just participate in the most competitive market in the world - they run it.
This sentiment is reinforced here:
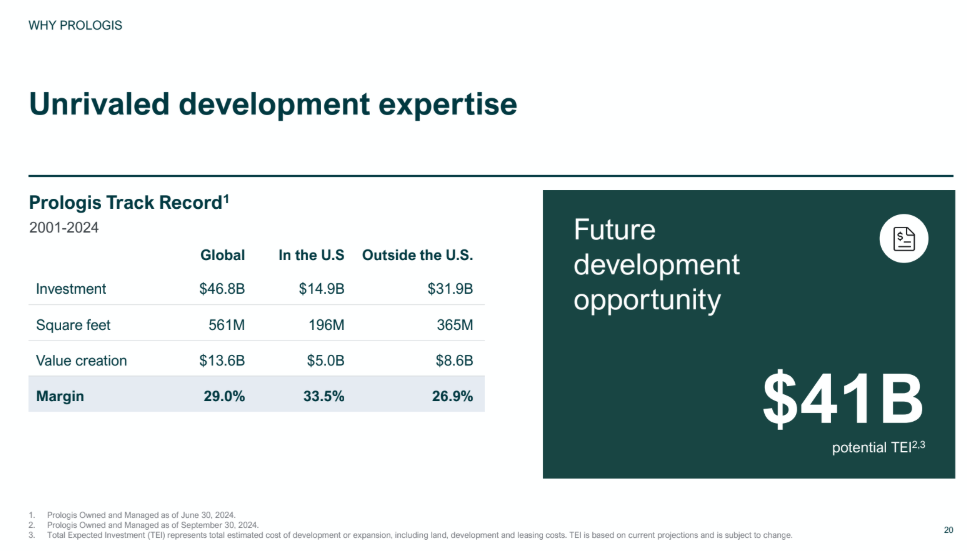
In a market where securing developable land near population centers becomes harder each year, Prologis has already locked up enough land to control supply in key markets for years to come.
The global/U.S./international breakdown serves another subtle purpose - it proves the model works everywhere.
This isn't about individual project execution; it's about systematic value creation at a scale that competitors simply can't match.
Next, they hit net zero with a clean timeline slide:
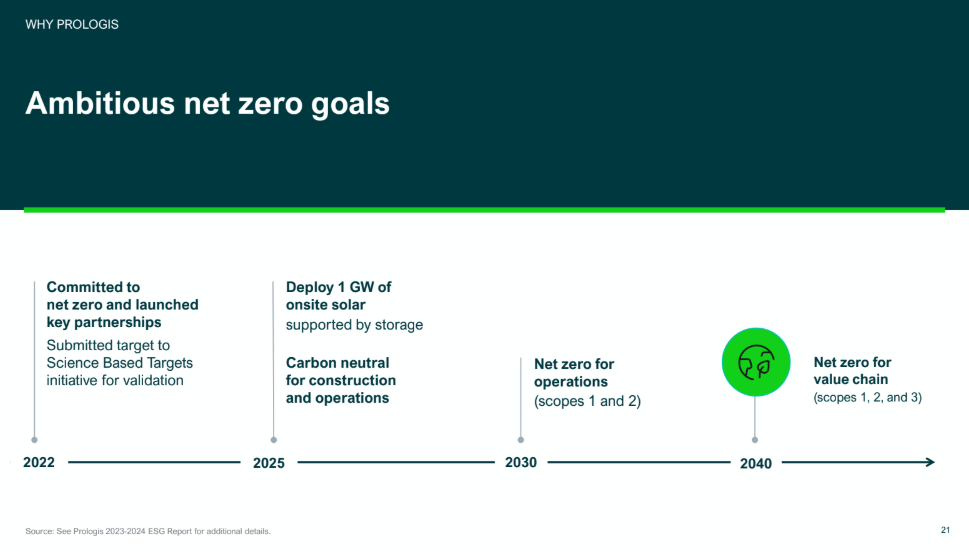
By targeting carbon neutrality for construction and operations by 2025, they're positioning themselves ahead of inevitable regulatory changes and tenant demands.
Then, the track record slide cranks out the raw performance data that institutional investors need:
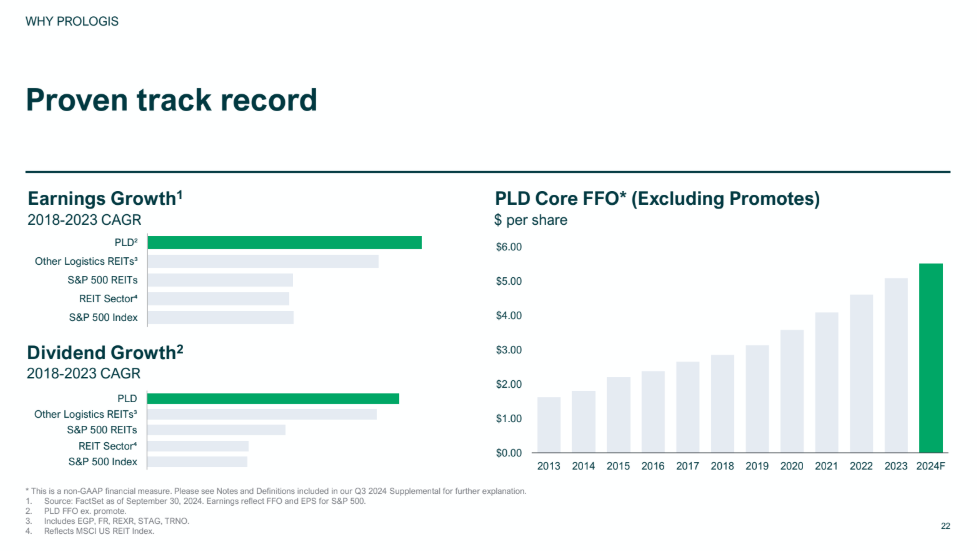
The consistent outperformance versus both REIT peers and the broader market validates Prologis's premium valuation.
This is predictable, manageable expansion.
This sets up the "Why Now" section perfectly - having built an airtight case for their operational excellence, they can focus entirely on market dynamics and timing.
Prologis opens their "Why Now" section with three slides that methodically build the case for perfect market timing:
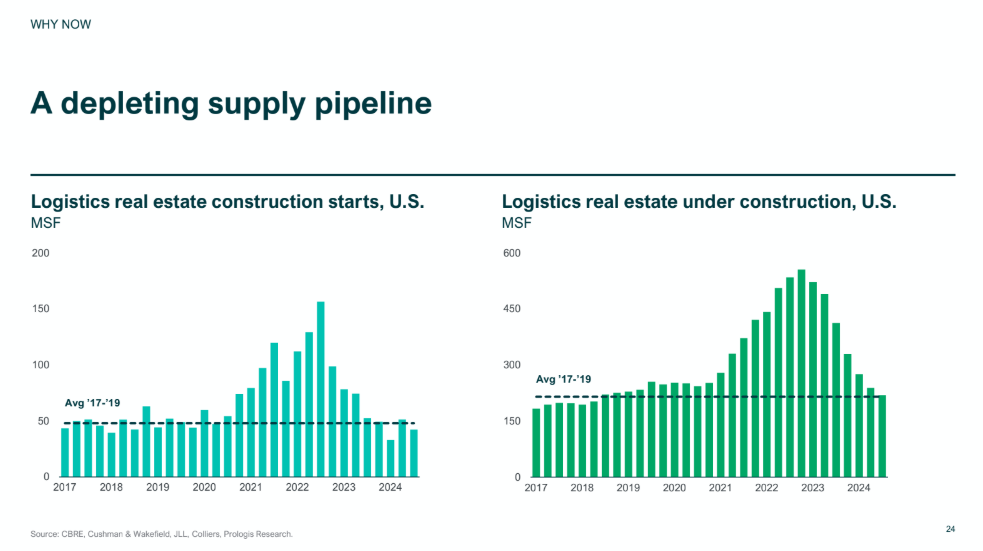
The construction pipeline analysis delivers a sophisticated message without ever saying it directly:
“We've hit the supply-demand inflection point that sophisticated investors dream about.”
By anchoring both charts to pre-pandemic averages, Prologis subtly establishes what "normal" looks like
The current trajectory back toward these baseline levels tells institutional investors exactly what they need to know:
The market is self-correcting to sustainable levels without overshooting to the downside.
The parallel declines in both starts and under-construction volume suggest a coordinated market response rather than panic-driven abandonment.
This pattern historically precedes periods of sustained rental rate growth - a fact that institutional investors will recognize immediately.
The embedded growth potential slide crystallizes why this supply constraint matters right now:
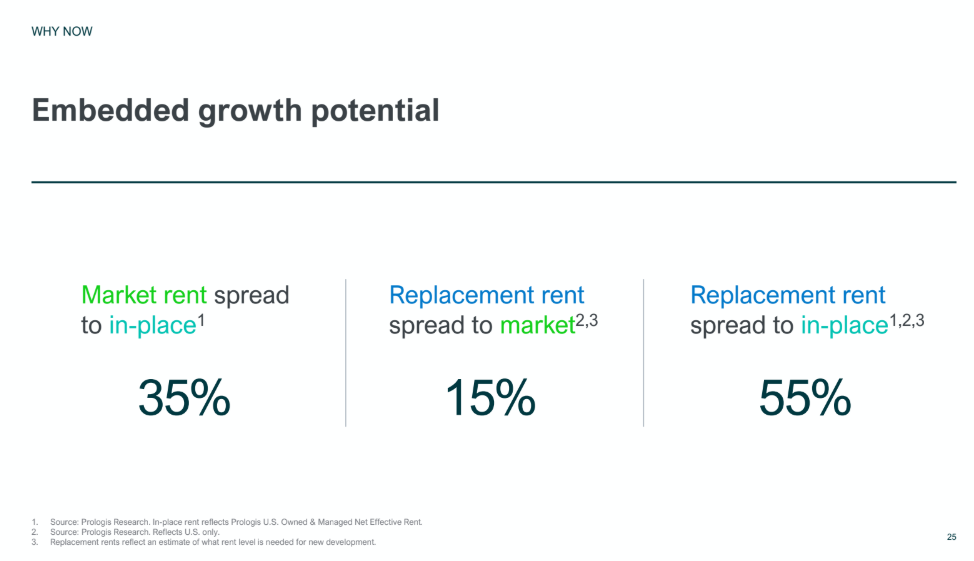
The 35% spread between in-place and market rents represents pure organic growth potential already locked into the portfolio.
But the real story emerges in the progression to replacement rents:
That 55% total spread between in-place and replacement rents shines a light on the true pricing power dynamics at play.
New supply can't compete economically with existing assets until rents rise substantially.
Prologis has effectively created a pricing umbrella that protects their ability to raise rents without fear of new competition.
Next, they provide the institutional framework needed to act on this opportunity:
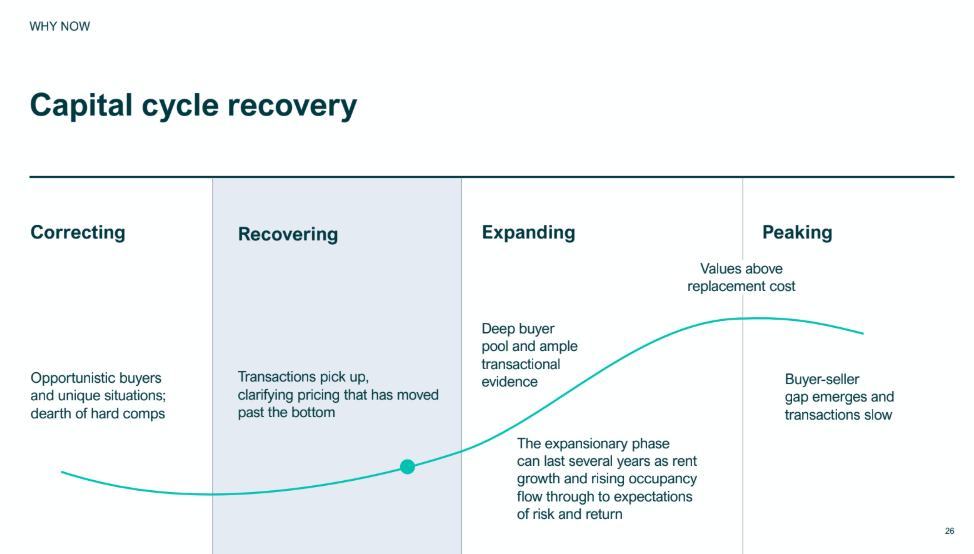
By highlighting the "Recovering" phase with subtle blue shading, Prologis communicates their conviction about exactly where we are in the cycle.
The elegant upward curve illustrates how current market dynamics - declining construction, embedded rent growth, and high replacement costs - create a formula for sustained expansion.
The dot placement on the curve suggests we're past the bottom but still early in the recovery, offering investors both downside protection and substantial upside potential.
By leading with supply fundamentals rather than demand projections, Prologis demonstrates sophisticated cycle thinking.
They've identified the precise market conditions that historically generate outsized returns in real estate:
Constrained supply, embedded growth, and clear cycle positioning.
The argument resonates because it aligns with how institutional investors actually underwrite cyclical opportunities.
Next, the illustrated data center strategy demonstrates how they leverage existing advantages into new value streams:
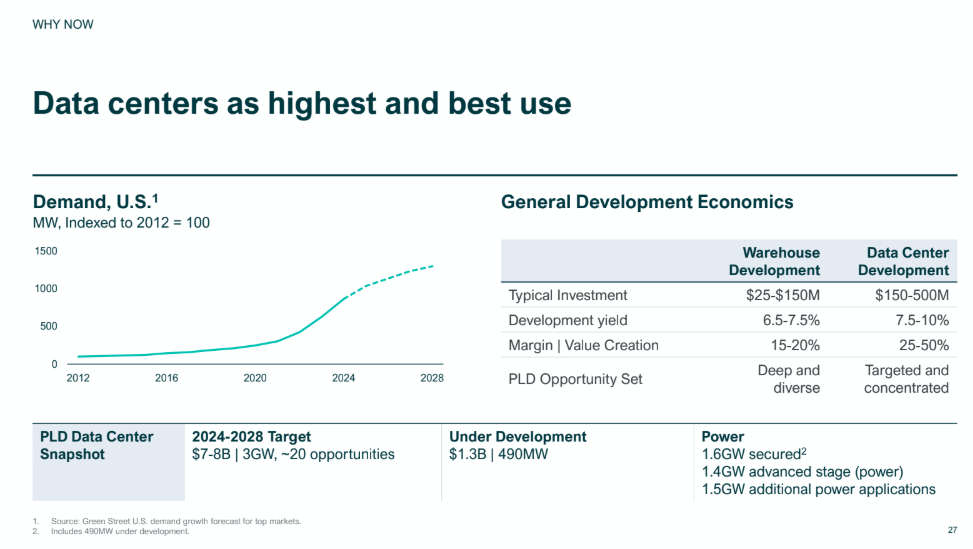
While other REITs chase traditional development opportunities, Prologis has identified a higher-value use case for strategic land positions.
Data center development generates margins of 25-50% compared to 15-20% for traditional warehouse development. The $7-8B pipeline targeting 3GW of development proves this isn't a side project - it's a calculated expansion into higher-yield opportunities.
The power statistics at the bottom of the slide highlight Prologis's true advantage:
With 1.6GW secured, 1.4GW in advanced stage, and another 1.5GW in the pipeline, they've already locked up the most critical component of data center development.
In a market where power access determines project viability, Prologis has quietly built an insurmountable lead.
The final slide distills everything into four chapters of an investment thesis that practically writes itself:
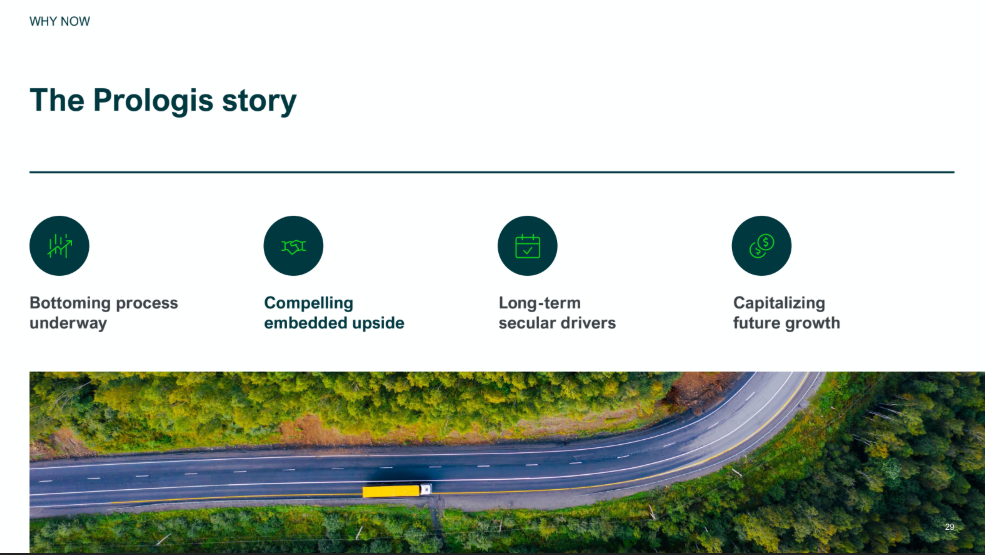
From acknowledging current market dynamics to quantifying embedded value…
From identifying structural growth drivers to demonstrating value capture mechanisms…
Each element here builds upon the last.
The aerial photograph serves as a perfect metaphor for Prologis's overall vision - a single truck navigating a winding road through verdant landscape, suggesting both the essential nature of logistics infrastructure and Prologis's ability to see around corners others miss.
The progression of this presentation answers every crucial question:
Where is additional value hidden? (Data center strategy)
Why is there an opportunity now? (Valuation dislocation)
How does it all fit together? (Strategic framework)
Prologis closes not with promises but with proof - proof of foresight in their data center expansion, proof of market opportunity in their valuation metrics, and proof of execution capability in their integrated framework.
Why This Presentation Works
Prologis could have relied solely on their market dominance to make their case.
With $218B in assets under management and 1.2B square feet across four continents, the numbers alone may have been enough.
Instead, they chose a more sophisticated path, building a presentation that positioned themselves at the forefront of market leadership and strategic advantage.
This presentation anticipates and addresses institutional investor concerns before they arise.
Supply constraints? Here's the depleting pipeline data. Execution risk? Here's the development track record. Valuation concerns? Here's the mathematical case for correction.
Throughout the deck, Prologis maintains an unwavering focus on their core value proposition:
They don't just own logistics real estate - they create the infrastructure that enables modern commerce.
And by the final slides, this analysis feels inevitable rather than forced.
This combination of analytical rigor and strategic clarity creates an investment case perfectly calibrated for institutional audiences.
Prologis doesn't ask investors to believe in their vision - they provide the data, framework, and a clear roadmap that makes investing feel like the only logical conclusion.
By maintaining this delicate balance between sophistication and clarity, Prologis accomplishes something remarkable:
They make their market leadership feel both earned and sustainable.
For institutional investors seeking to deploy capital at scale while maintaining discipline, this presentation makes Prologis feel less like an option and more like the only path forward.
Real quick...
Does your pitch tell a story as compelling as Prologis's? BetterPitch specializes in creating investment materials that resonate with institutional investors. From market analysis to strategy presentation, we help managers build world-class marketing collateral to raise capital more efficiently.
See you next friday,
What do you think?Give us feedback! |
Reading this and not subscribed?