- PitchDeckGuy
- Posts
- Realty Income's November 2024 Evolution to Global Real Estate Leader
Realty Income's November 2024 Evolution to Global Real Estate Leader
Niko From Collateral
January 31, 2025

Hello PitchDeckGuy readers!
In this week's analysis, we examine how Realty Income transformed from a U.S.-focused net lease REIT into a global powerhouse commanding an ~$83 billion enterprise value.
Their journey showcases how patient execution and strategic expansion can turn a focused real estate strategy into an institutional-scale platform.
First, we'll explore Realty Income's evolution from its 1969 origins through its current position as the 7th largest global REIT, talking through how methodical growth and carefully curated diversification created an unmatched platform in the net lease space.
Then, we'll dissect their Q3 2024 presentation, examining how their focused strategy in an often overlooked corner of real estate created near “no brainer” opportunities for both corporate clients and institutional investors alike.
Finally, we'll explain why their approach resonates so powerfully - and how their pitch positions Realty Income as a definitive institutional-grade platform in their space, while highlighting the specialized capabilities that make them unique.
A Vast Opportunity, Right In Your Neighborhood
When Realty Income presented their investor pitch in November 2024, it validated a thesis over 55 years in the making:
That building the world's preeminent net lease platform could create extraordinary value for both corporate occupiers and institutional investors.
Their domain - net lease real estate - would prove capable of delivering consistent returns while amassing a nearly $58 billion portfolio across eight countries.
The pitch deck tells the story of a company that has maintained its fundamental approach while dramatically expanding its capabilities and reach.
Today, Realty Income's scale encompasses over 15,450 properties, generating approximately $4.9 billion in annualized base rent.
Their systematic growth is evident in the numbers. Occupancy has remained above 98%, even through major economic disruptions.
They've accumulated 652 consecutive monthly dividends and 108 quarterly dividend increases. Most tellingly, they've earned inclusion in the S&P 500 Dividend Aristocrats index.
But in 2024, an even more dramatic story was unfolding.
After establishing themselves as the dominant U.S. net lease platform, Realty Income had successfully expanded into Europe, where public REITs accounted for less than 0.1% of the total addressable market.
This opportunity emerged precisely as major corporations worldwide were fundamentally reconsidering their real estate strategies in a higher-cost capital environment.
Market Context & Opportunity
We’ve spoken a lot about “unprecedented challenges” and extreme pressure in this sector – from shifting work and consumer patterns.
In this context, Realty Income's portfolio demonstrated remarkable resilience, with approximately 90% of rents coming from tenants either resilient to economic downturns, isolated from e-commerce pressures, or both.
Beyond their core performance metrics, this is fundamentally a story about identifying and systematically capturing market opportunity.
The total addressable market for net lease properties had reached extraordinary scale - $5.4 trillion in the U.S. and $8.5 trillion in Europe. Annual transaction volume in their target sectors exceeded $90 billion.
And Realty Income's positioning proved particularly advantageous as corporations reassessed their real estate strategies.
Their three-pillar approach to risk management resonated strongly with institutional investors:
Focusing on tenant quality
Strategic property selection
Structural protection
Against this backdrop, Realty Income's pitch demonstrated how methodical execution in an overlooked sector could create extraordinary value during periods of market transformation – on the tail end of massive and yet-emergent turmoil.
The context is established - now let's examine their pitch in detail.
Building the Case for Global Leadership
The first slide presents a deceptively straightforward overview that accomplishes it’s goal right off the bat:
It transforms what many view as a traditional net lease business into a global real estate powerhouse.
The visual organization is precise and purposeful:
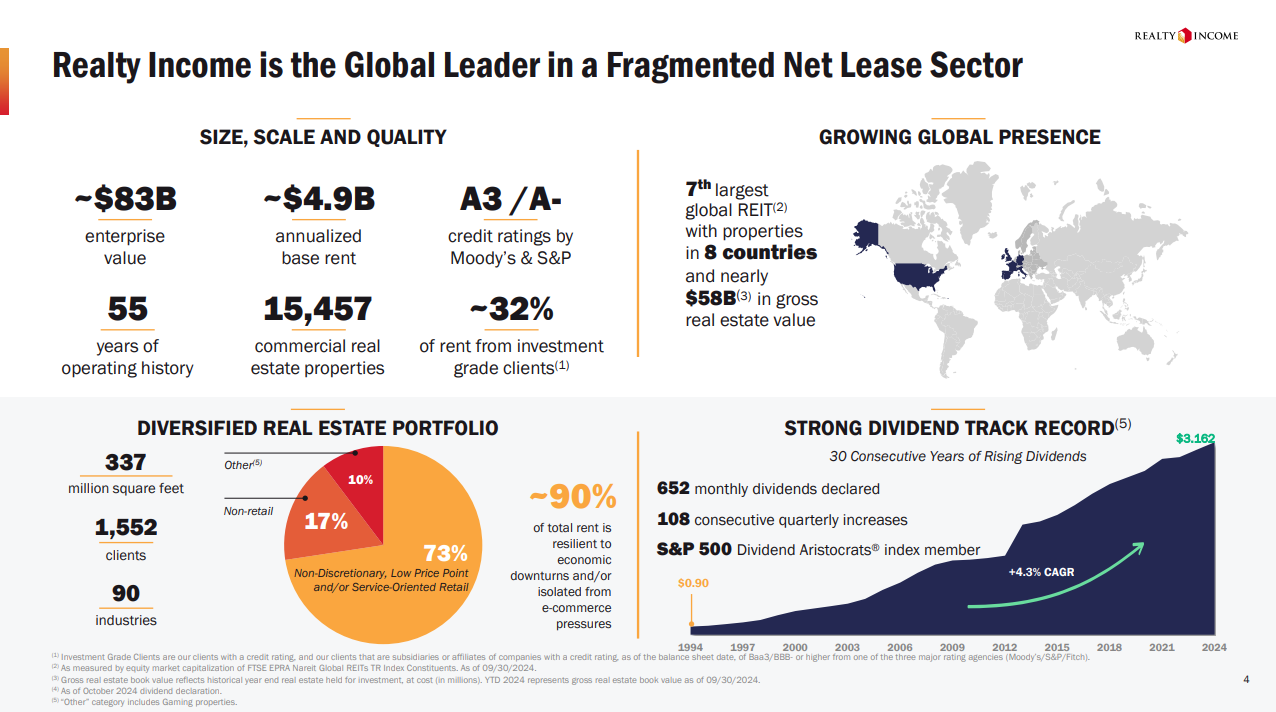
By leading with "Size, Scale and Quality" metrics directly adjacent to "Growing Global Presence," they immediately reframe the traditional perception of net lease REITs.
This positioning accomplishes several critical objectives:
The $83 billion enterprise value and $4.9 billion in annualized base rent establish pure scale.
But it's the juxtaposition with their A3/A- credit ratings that elevates the narrative from size to institutional quality.
This subtle connection transforms impressive numbers into evidence of sophisticated operation.
They leverage their 55-year operating history alongside their current global footprint.
This combination quietly communicates that their international expansion represents natural evolution rather than speculative growth - a critical distinction for institutional investors.
Next, Realty Income demonstrates how institutional-grade operations translate into consistent performance across multiple metrics:
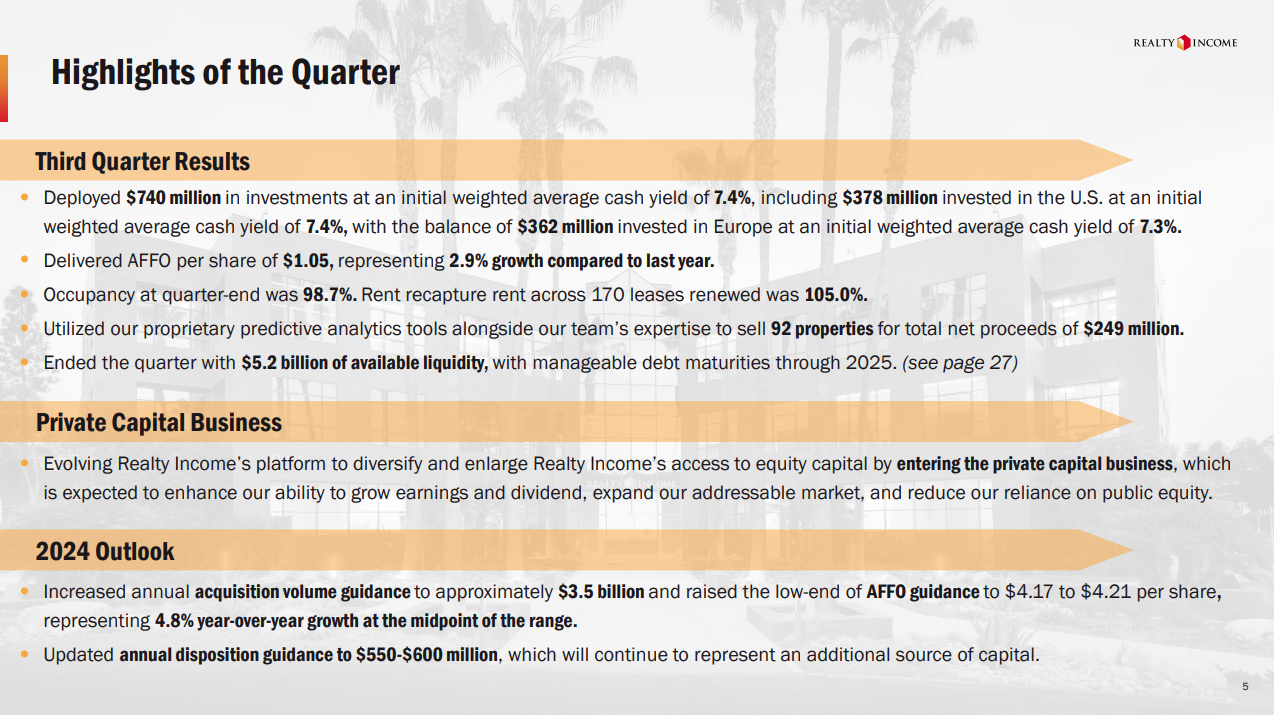
By breaking down $740 million of deployments between U.S. (7.4% yield) and European (7.3% yield) investments, they accomplish two things simultaneously:
They demonstrate their ability to source attractive yields while subtly highlighting the consistency of returns across markets.
This consistency itself becomes evidence of their sophisticated investment approach.
The 98.7% occupancy rate paired with 105% lease renewal spreads tells an equally compelling tale of asset management capabilities…
But it's the mention of their proprietary analytics platform guiding 92 property dispositions that truly elevates the narrative - transforming standard portfolio management into data-driven capital allocation.
The next slide presents what appears as a simple comparison between U.S. and European markets:
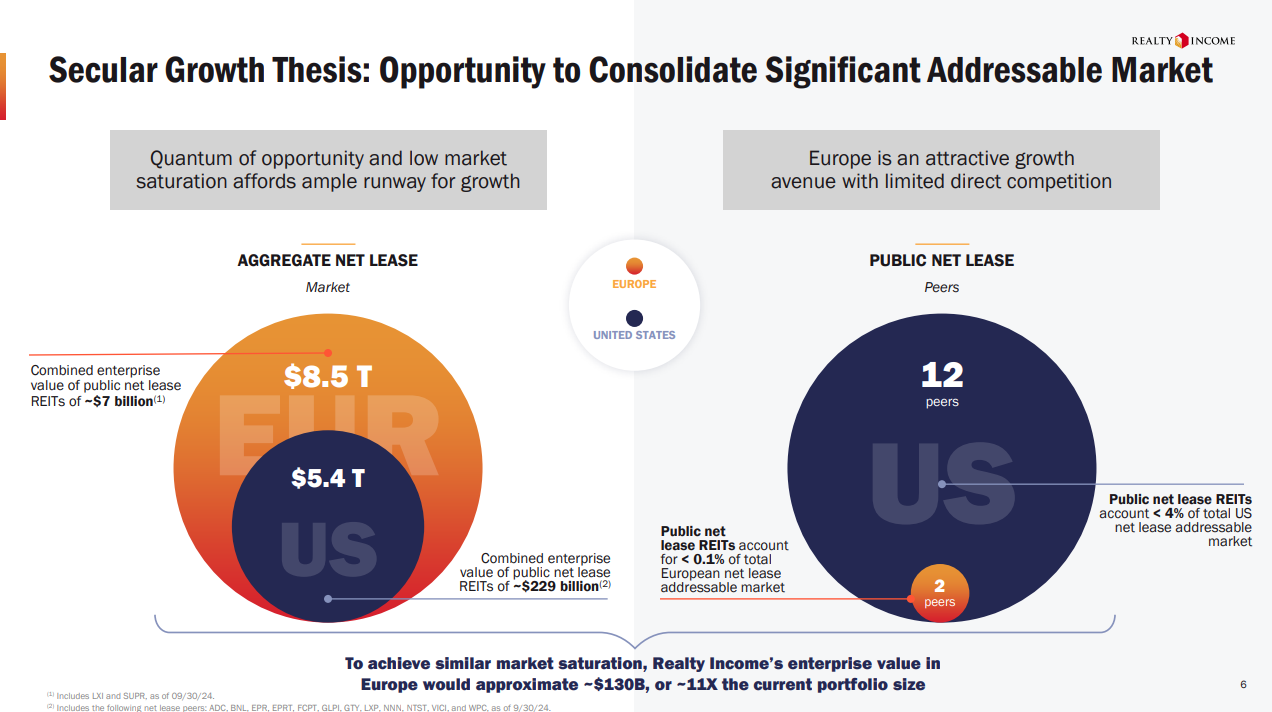
This is a great visualization in that it’s easy on the eyes, but sophisticated in message.
By presenting the European market at $8.5 trillion alongside the U.S. at $5.4 trillion, they establish massive scale.
But it's the penetration metrics that deliver the key insight:
Public REITs represent less than 0.1% of the European market compared to nearly 4% in the U.S.
The visual organization reinforces this narrative.
The European market circle visually engulfs the U.S. market circle, while the peer comparison shows just 2 European peers versus 12 U.S. peers.
This creates an immediate, intuitive understanding of the opportunity without requiring complex explanation.
Next up is geographic expansion to vertical expansion, revealing $5.4 trillion of U.S. opportunities across an intelligently segmented market:
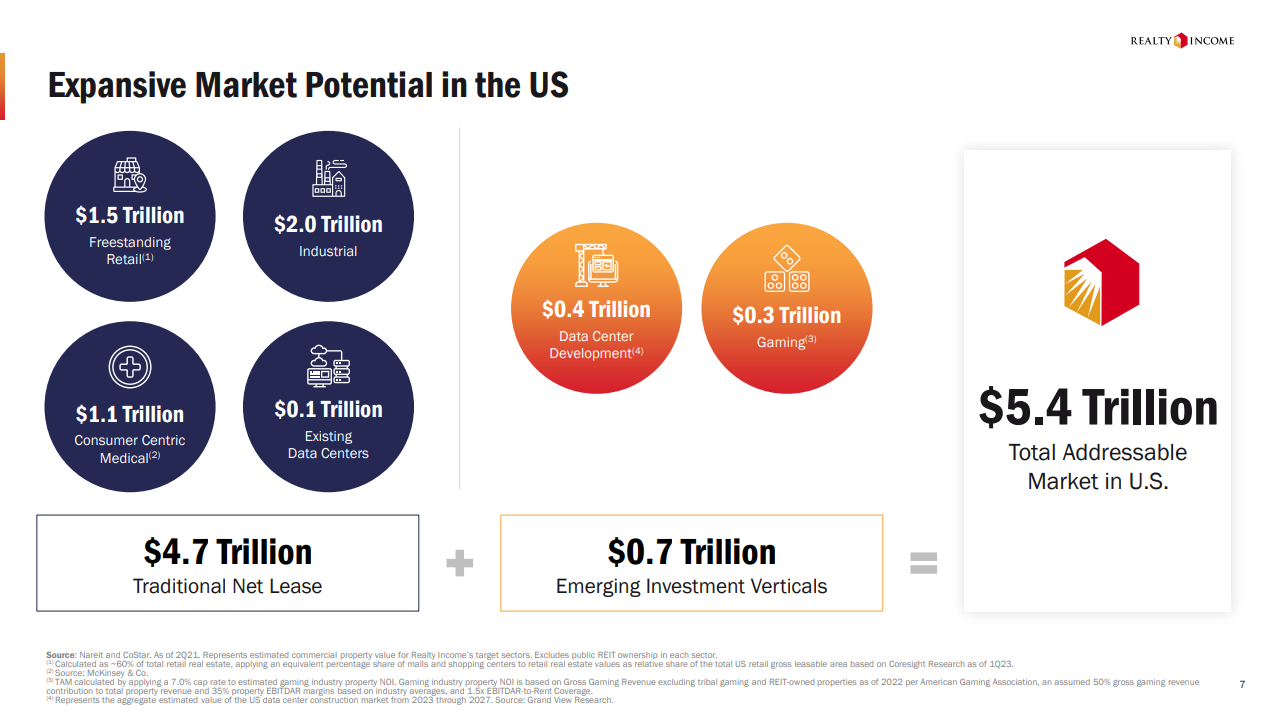
The presentation of these verticals demonstrates sophisticated portfolio construction.
Traditional segments like freestanding retail ($1.5T) and industrial ($2.0T) provide proven scale. Consumer-centric medical ($1.1T) offers defensive characteristics.
Meanwhile, data centers ($0.5T combined) and gaming ($0.3T) provide growth vectors.
And by separating $4.7T of "Traditional Net Lease" from $0.7T of "Emerging Investment Verticals," they showcase both the stability of their core business and their capacity to capture emerging opportunities.
This progression - from geographic scale to operational excellence to market opportunity to vertical expansion - establishes the foundation.
Another pleasant visual manages to distill the $8.5 trillion opportunity quite nicely:
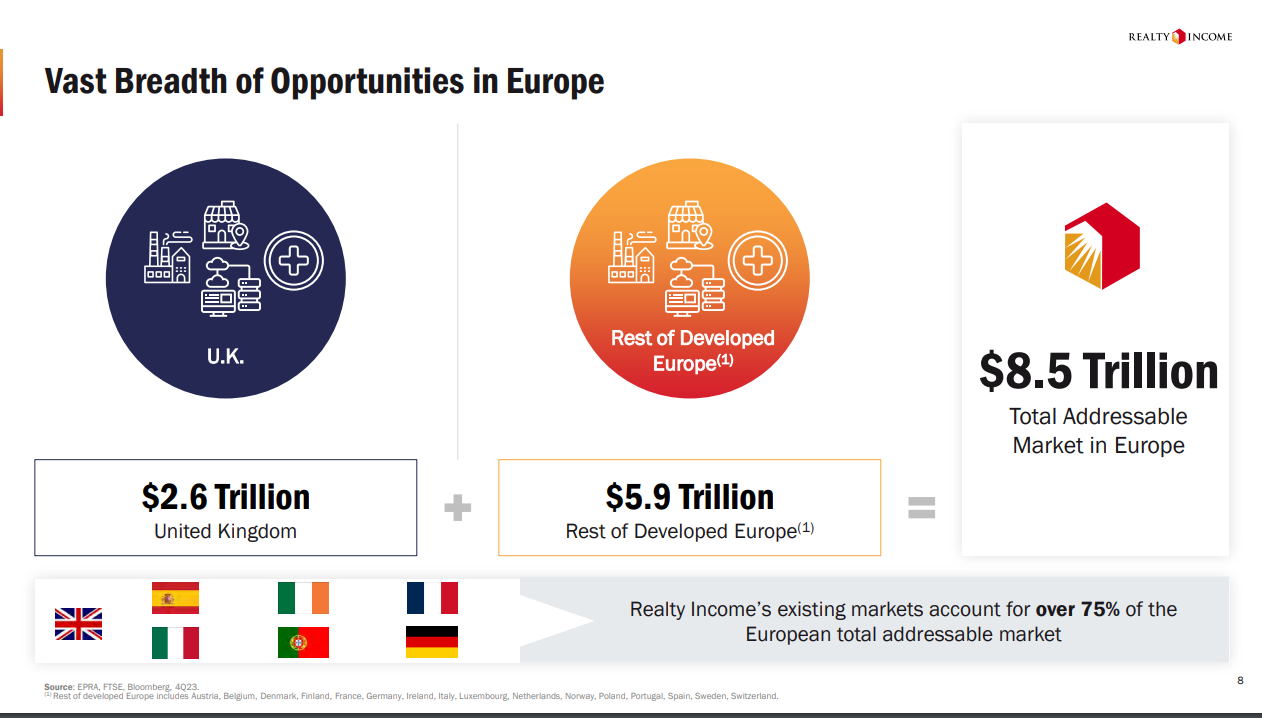
We are presented with the United Kingdom ($2.6T) and Rest of Developed Europe ($5.9T), illustrating both the scale of their current operations and their expansion runway.
Icons representing industrial, retail, and healthcare properties appear identically in both the U.K. and continental Europe circles, emphasizing the transferability of their investment approach across borders.
This standardization transforms what could seem like geographic risk into operational opportunity.
A critical detail appears at the bottom:
Their existing markets already encompass over 75% of the total European addressable market.
This transforms what might appear as limited geographic coverage into evidence of strategic market selection.
The next slide demonstrates advanced financial engineering through two parallel scenarios analyzing a $500 million sale-leaseback transaction:
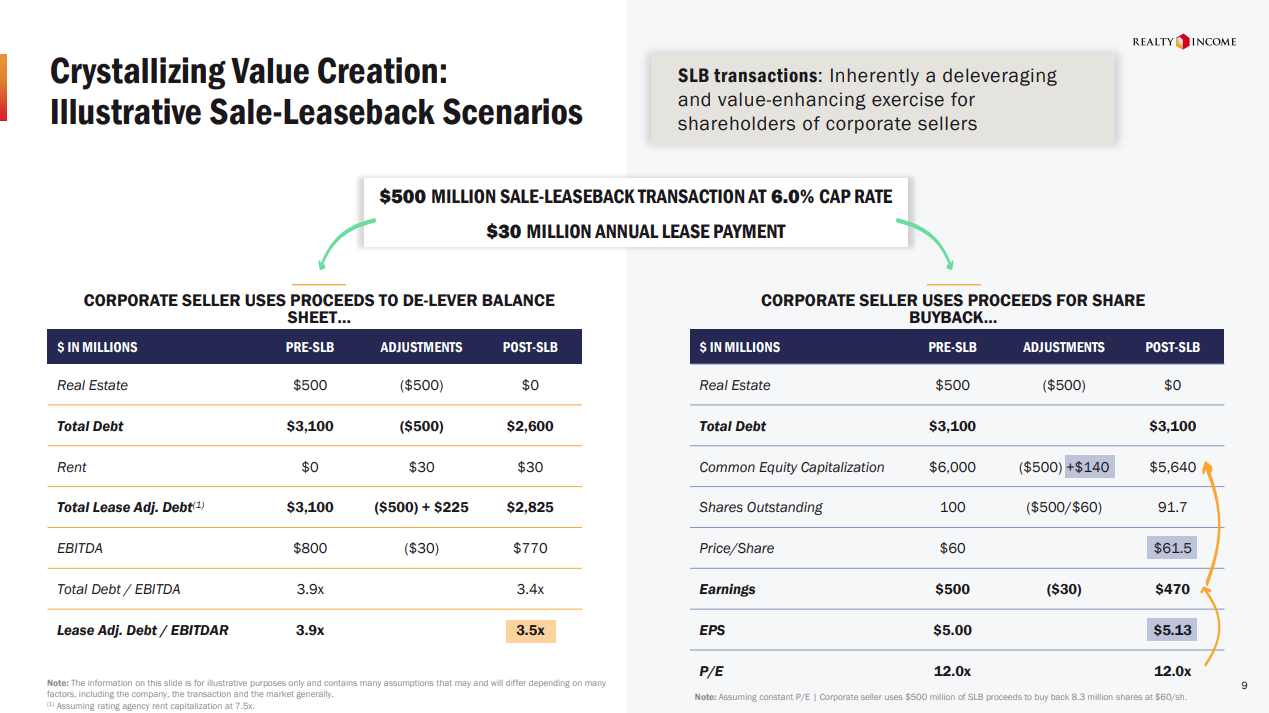
The presentation transcends typical transaction analysis by showing how their platform creates value for both sides of the trade.
The left scenario traces balance sheet deleveraging, where a 6.0% cap rate transaction reduces total lease-adjusted leverage from 3.9x to 3.5x.
The right scenario models share repurchase accretion, demonstrating EPS growth from $5.00 to $5.13.
This dual-path analysis accomplishes something incredibly useful:
It positions Realty Income not just as a capital provider but as a strategic partner in corporate finance optimization.
Plus, the mathematical precision of the analysis reinforces their institutional sophistication. This becomes a theme throughout the entire presentation.
Here Realty shifts focus to historical performance with an understated declaration:
Positive Total Operational Return every year as a public company.

The image selection reinforces the message - a high-quality property with evident pride of ownership, suggesting the connection between asset quality and return consistency.
This visual-textual combination turns what could read as a basic performance claim into tangible evidence.
The property image serves as physical proof of their investment philosophy in action.
And the next slide addresses the critical question of interest rate sensitivity through multi-decade performance data:
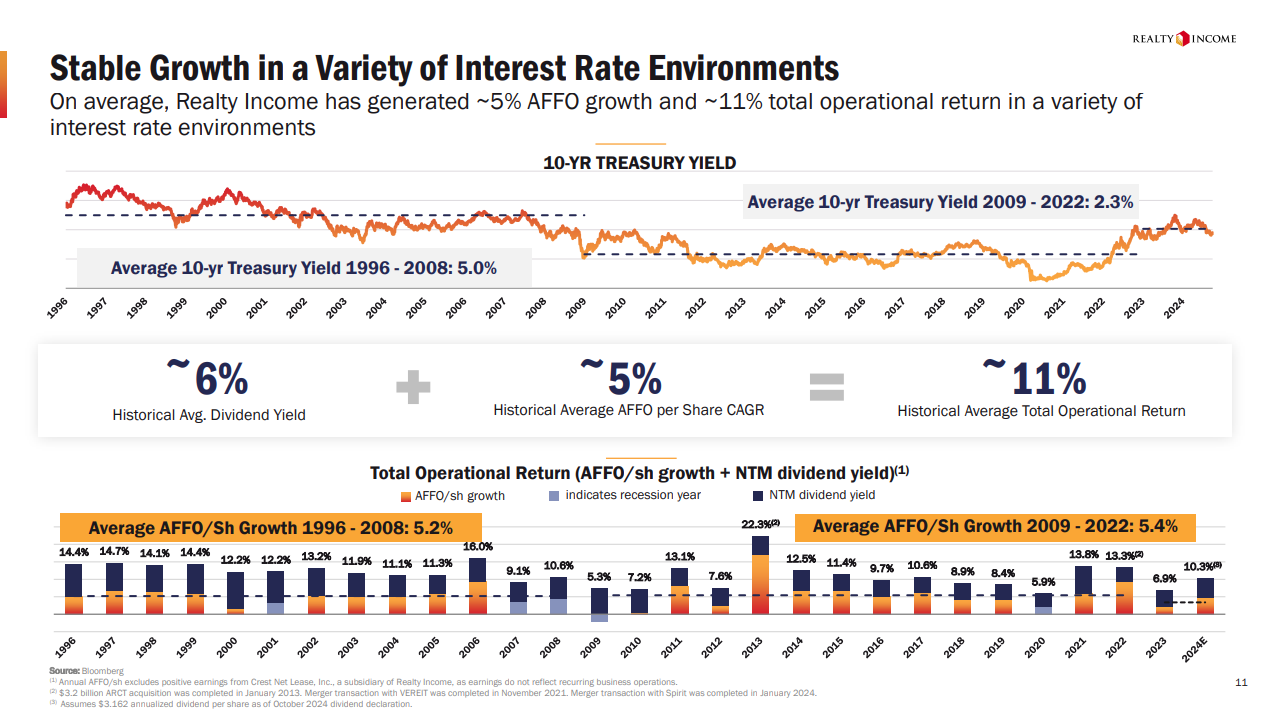
The presentation shows consistent 5% AFFO growth against treasury yields ranging from 2.3% to 5.0%.
The visual organization excels in several dimensions:
The treasury yield curve provides immediate context
Color-coded recession bands highlight economic stress-testing
Performance metrics decomposed into AFFO growth and dividend yield
Clear demonstration of 4.3% dividend CAGR
This layered analysis transforms interest rate risk from a potential weakness into proof of their model's durability.
Consistent returns across rate cycles serve as empirical validation of their investment approach.
The next sequence demonstrates sophisticated psychological architecture in addressing investor anxieties about interest rate exposure:
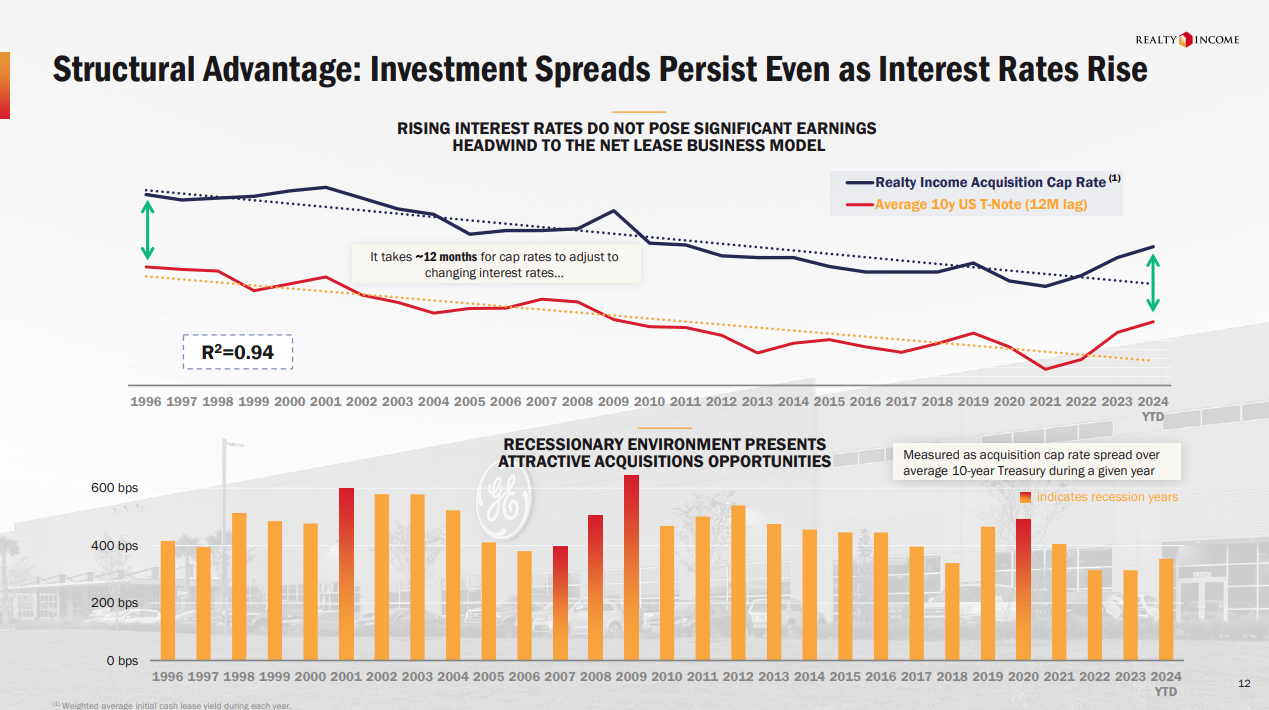
Rather than simply defending against this concern, they transform it into evidence of their structural advantages in the market.
The visualization of cap rate spreads against treasury yields accomplishes this transformation through pure mathematics.
An R² of 0.94 between acquisition cap rates and lagged treasury yields doesn't just suggest correlation - it proves systematic pricing power.
This statistical relationship reframes the entire interest rate discussion:
What others see as risk, Realty Income presents as a mechanical advantage in their business model.
The 12-month lag in cap rate adjustments reveals something even more valuable to institutional investors:
Predictable spread capture during periods of market stress.
This isn't just about maintaining yields - it's about expanding them precisely when competitors struggle to execute.
Having neutralized the interest rate concern, Realty Income shifts investor focus toward their expansion capabilities:

This visual choice carries psychological weight: it shows evolution without abandonment, progress without risk.
Put simply, the CVS Pharmacy image serves as a bridge between their traditional strengths and future opportunities.
By demonstrating how new verticals emerge from existing competencies, they create a growth narrative that requires no leap of faith.
Each new sector flows naturally from proven execution capabilities, transforming the unknown into the logical next step.
With market concerns addressed and expansion capabilities established, Realty Income unveils their data center strategy at precisely the right moment:
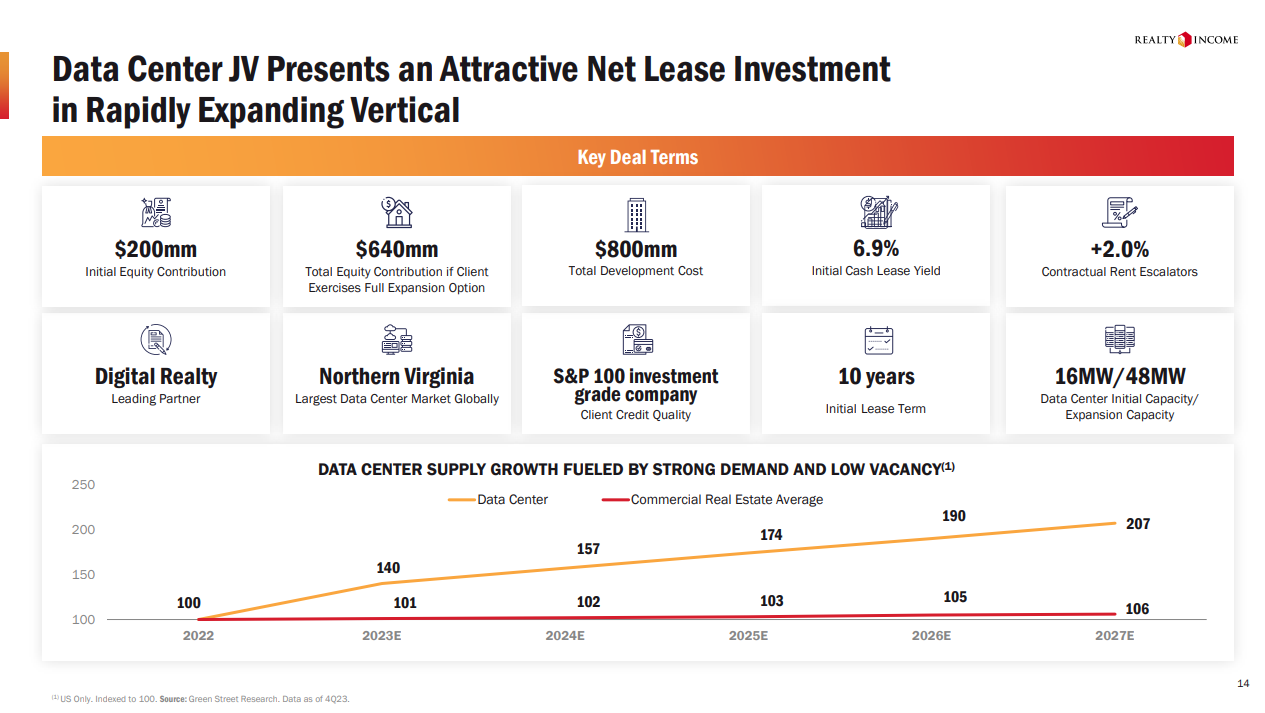
The joint venture structure itself speaks volumes about their institutional sophistication - they're not just entering a new sector, they're doing so through partnership with Digital Realty, the sector's established leader.
The deal terms reveal careful attention to institutional psychology.
The initial $200M commitment establishes meaningful scale while the expansion option to $640M provides embedded growth.
The 6.9% initial yield maintains discipline while the S&P 100 tenant credit quality ensures institutional acceptability. Each element has been calibrated for investment committee approval.
On the next slide, the statement is clear:
This isn't about entering a new sector; it's about entering through the sector's strongest market.
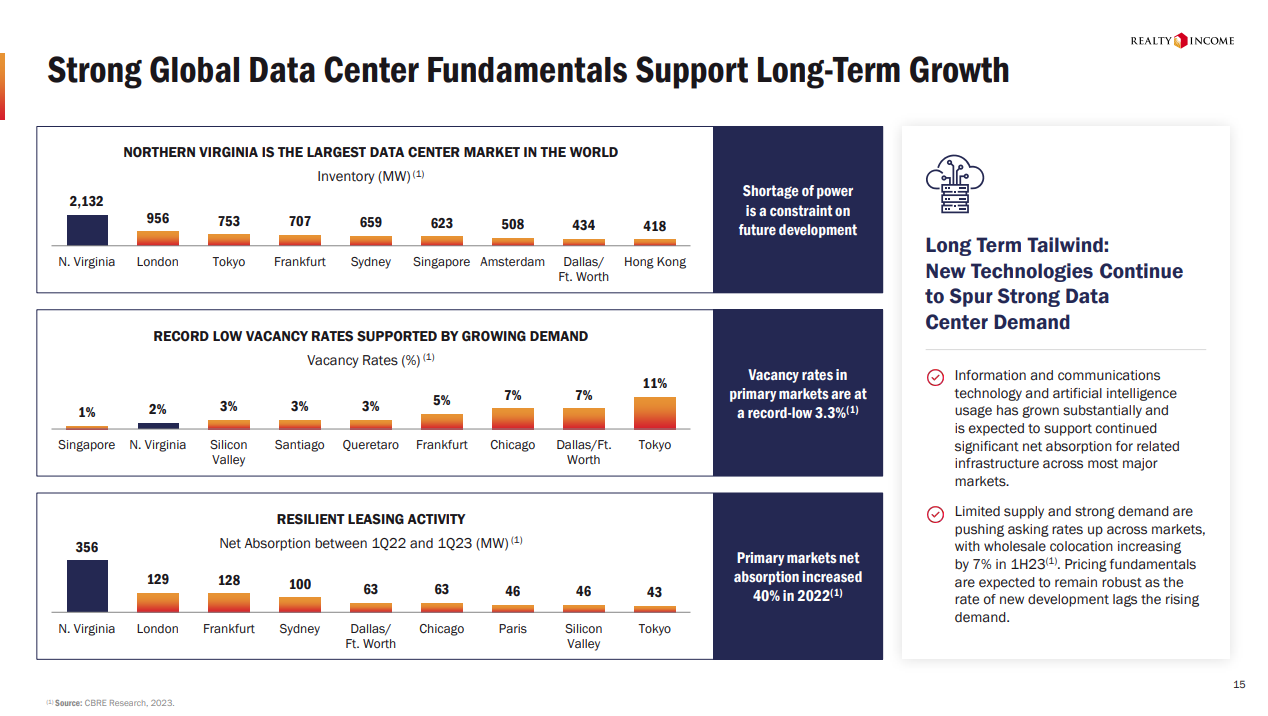
The Northern Virginia data center statistics serve as third-party validation of their strategic positioning.
The market's 2,132 MW of inventory more than doubles London's 956 MW.
Vacancy rates amplify the message:
Singapore at 1%, Northern Virginia at 2%, and Tokyo at 11% paint a picture of controlled scarcity.
The power shortage callout transforms a potential concern into evidence of barrier to entry.
Net absorption figures complete the thesis by demonstrating tenant demand precisely where Realty Income has positioned themselves.
Next up, the Decathlon transaction illuminates Realty Income's sophisticated approach to European expansion.
Their €527M acquisition across five countries demonstrates their ability to execute complex, cross-border transactions at institutional scale:
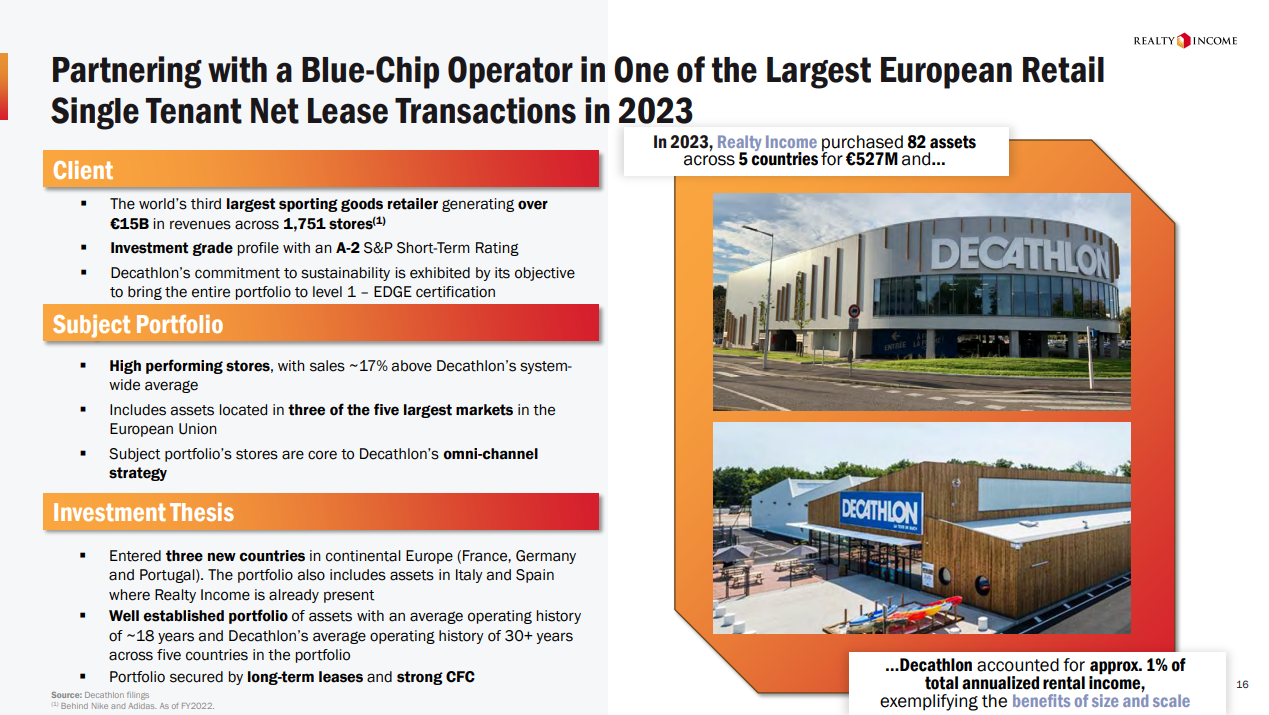
Decathlon's profile hits every institutional checkbox:
€15B in revenue, A-2 S&P rating, and a commitment to sustainability through EDGE certification.
But the real strategic value emerges from the portfolio composition - stores performing 17% above system average, positioned in three of Europe's five largest markets.
A deeper look at these target markets unveils the methodical thinking behind the geographic selection.
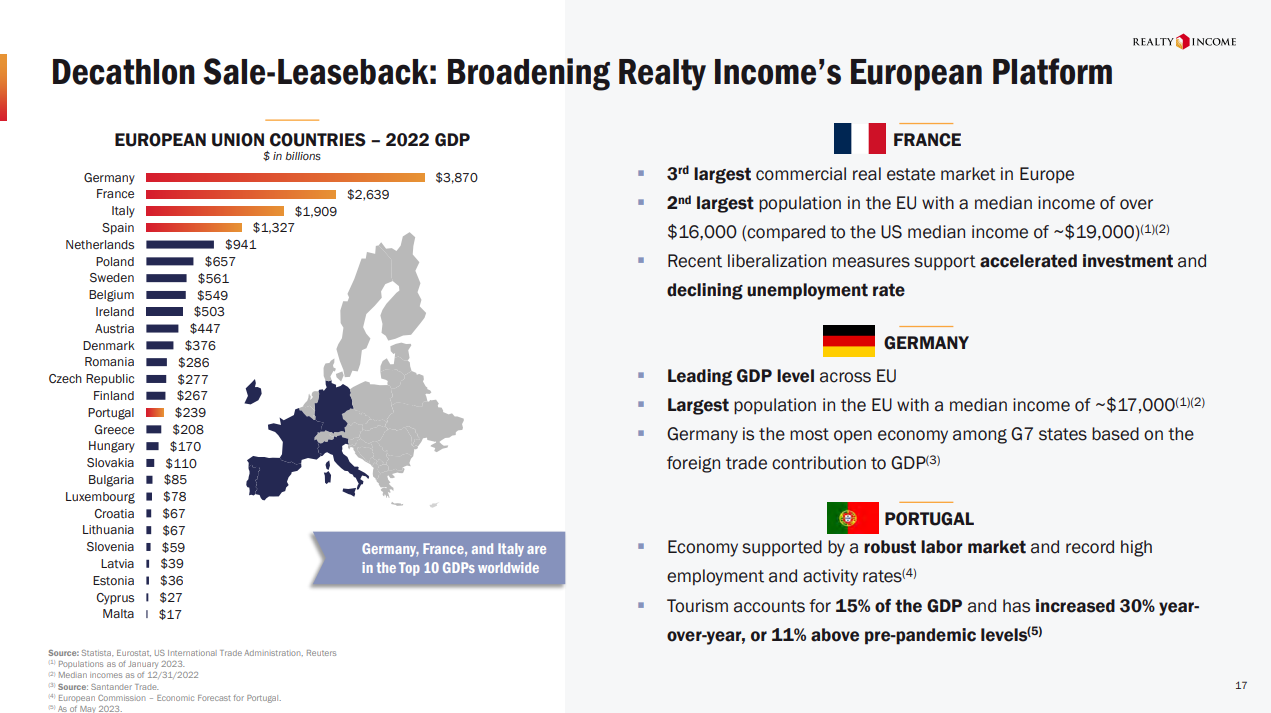
France, Germany, and Italy don't just represent Europe's largest economies - they embody distinct advantages that create multiple paths to value creation:
France brings the EU's third-largest commercial real estate market
Germany offers unmatched economic scale with the highest GDP and largest population
Portugal provides cyclical upside through tourism recovery, already 11% above pre-pandemic levels
This market selection transforms what might appear as geographic dispersion into strategic positioning across Europe's key growth vectors.
Moving from expansion to execution, Realty Income's performance metrics read like an institutional investor's wishlist…but not before they drop one of their slicker title slides:
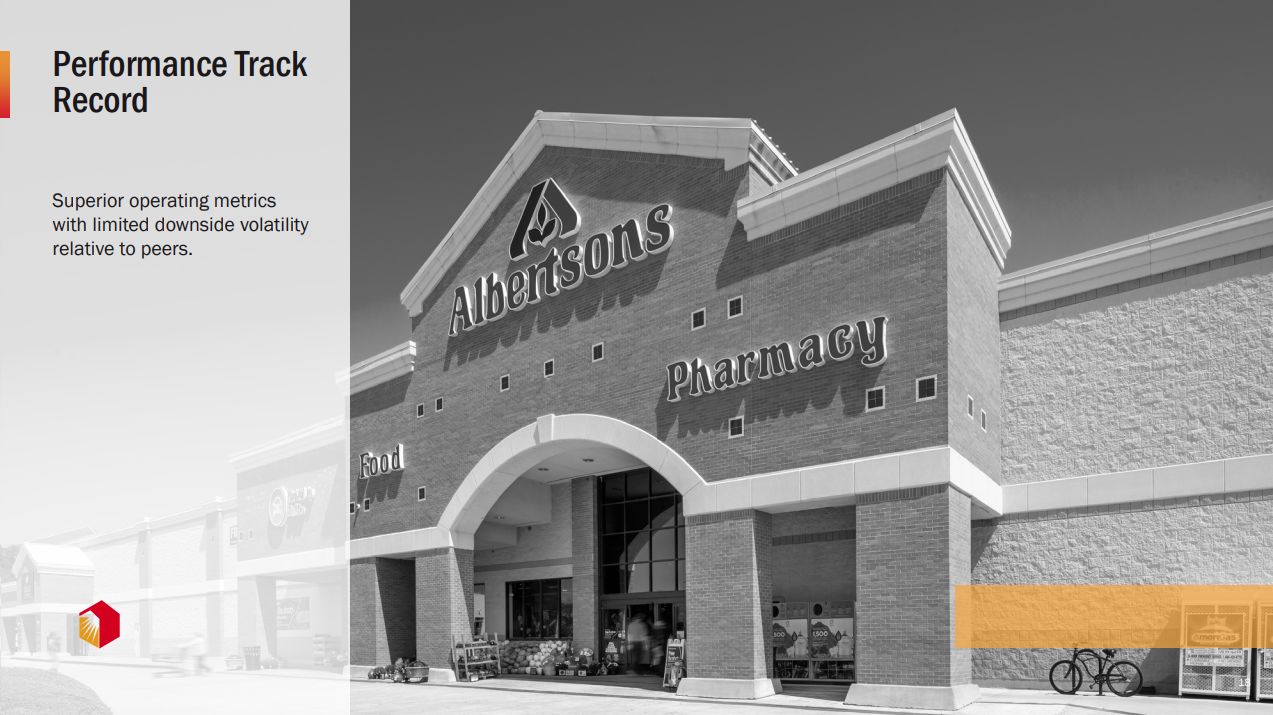
The copy on the intro slide is an exercise in careful positioning and setting expectations – “limited downside volatility relative to peers” is excellent programming.
And their track record combines growth with durability in ways that redefine risk-adjusted returns:
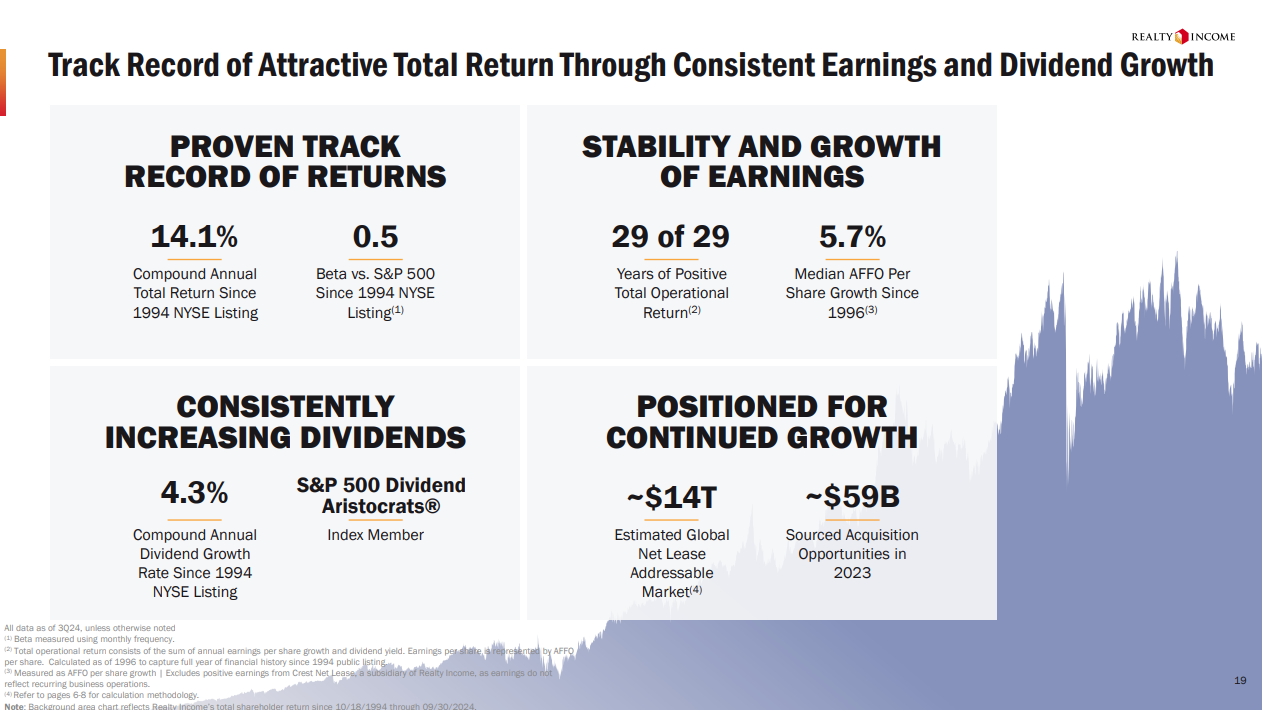
Quick-hits from this slide are tough to argue with:
14.1% compound annual total return since 1994
0.5 beta versus S&P 500
29 consecutive years of positive operational returns
5.7% median AFFO per share growth since 1996
But it's the volatility metrics that truly stand out:
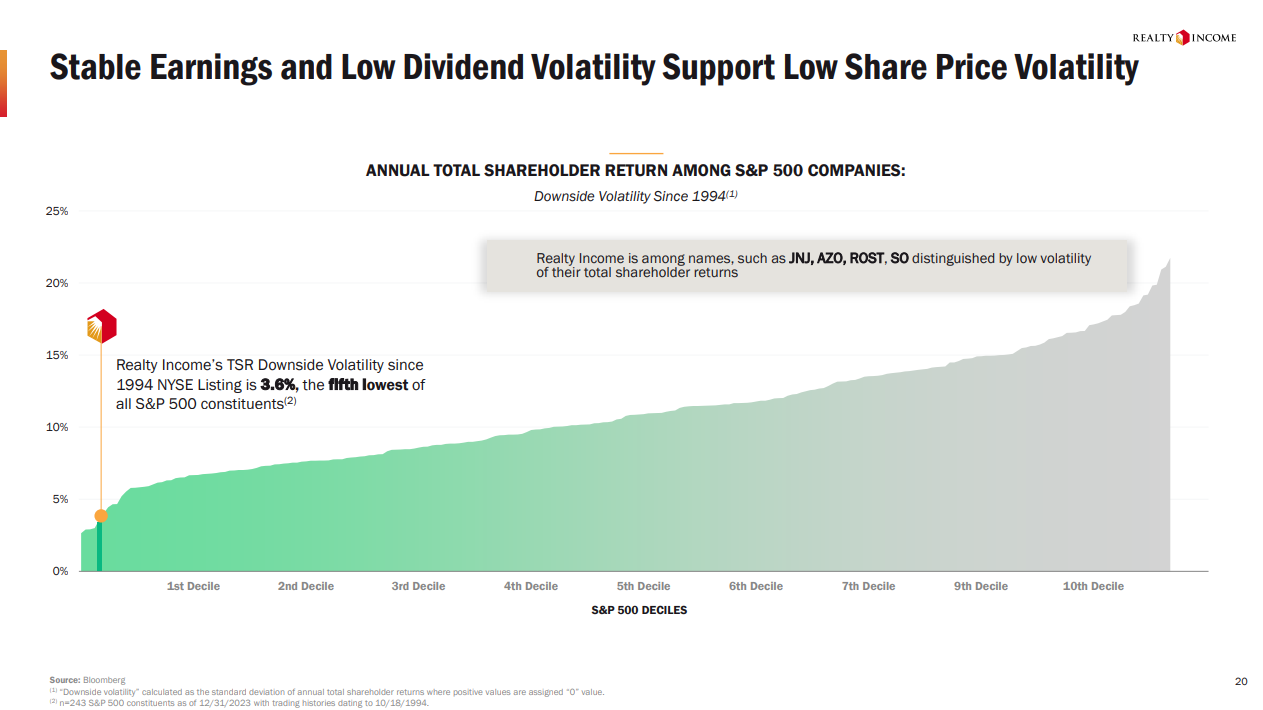
A TSR downside volatility of 3.6% - fifth lowest among all S&P 500 constituents - places them alongside defensive stalwarts like Johnson & Johnson and AutoZone.
This combination of returns and stability earns them a spot in the 91st percentile for return per unit of risk across the entire S&P 500.
The risk/reward visualization drives this point home (again) through pure mathematics:
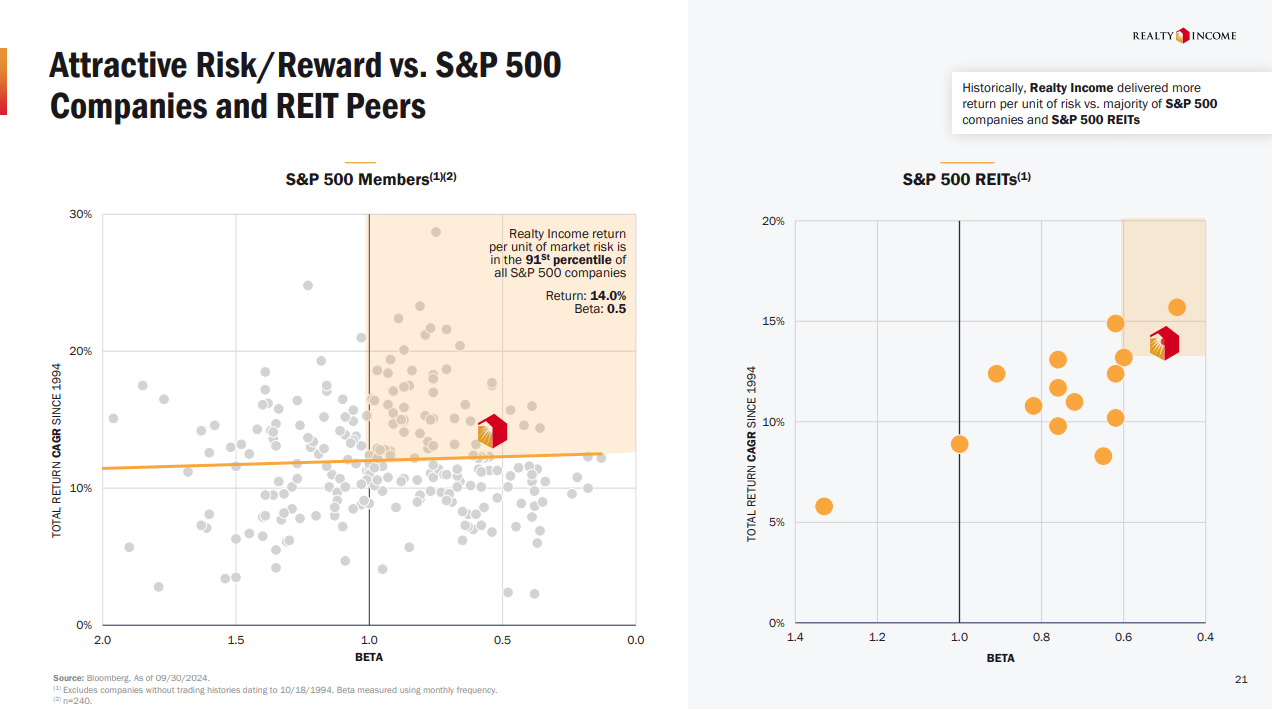
By plotting total return against beta, they demonstrate how their business model generates equity-like returns with bond-like volatility.
When compared specifically against other REITs, the advantage becomes stark - they've engineered a way to capture real estate returns while eliminating much of the associated volatility.
This performance analysis serves a deeper purpose in their pitch:
It validates their expansion strategy.
By demonstrating such precise control over risk-adjusted returns in their core business, they earn the credibility to pursue geographic and vertical expansion.
And the divergence between Realty Income and its peers deepens with occupancy - their 98.2% historical median towers above the peer average of 94.2%.
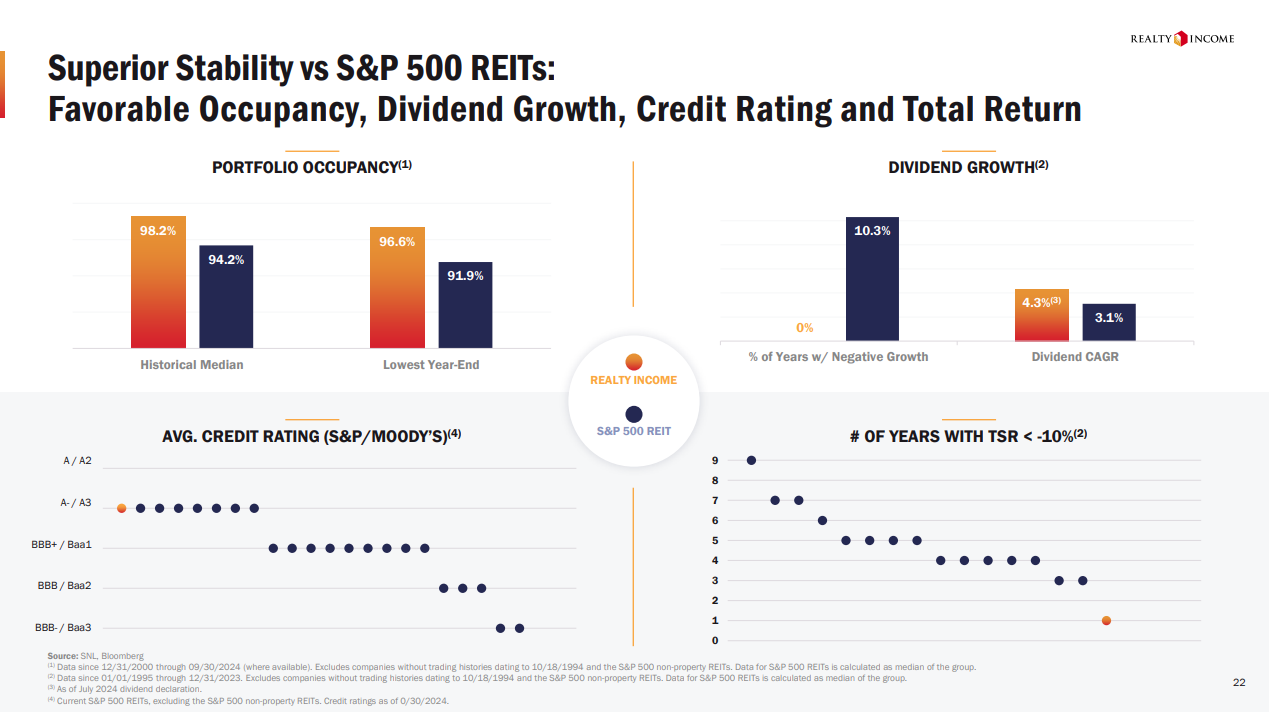
Yet this surface-level comparison barely hints at the depth of their operational superiority.
The real story emerges in their dividend trajectory: a 4.3% CAGR that doesn't just outpace the S&P 500 REIT average of 3.1%, but achieves this growth without a single year of negative performance.
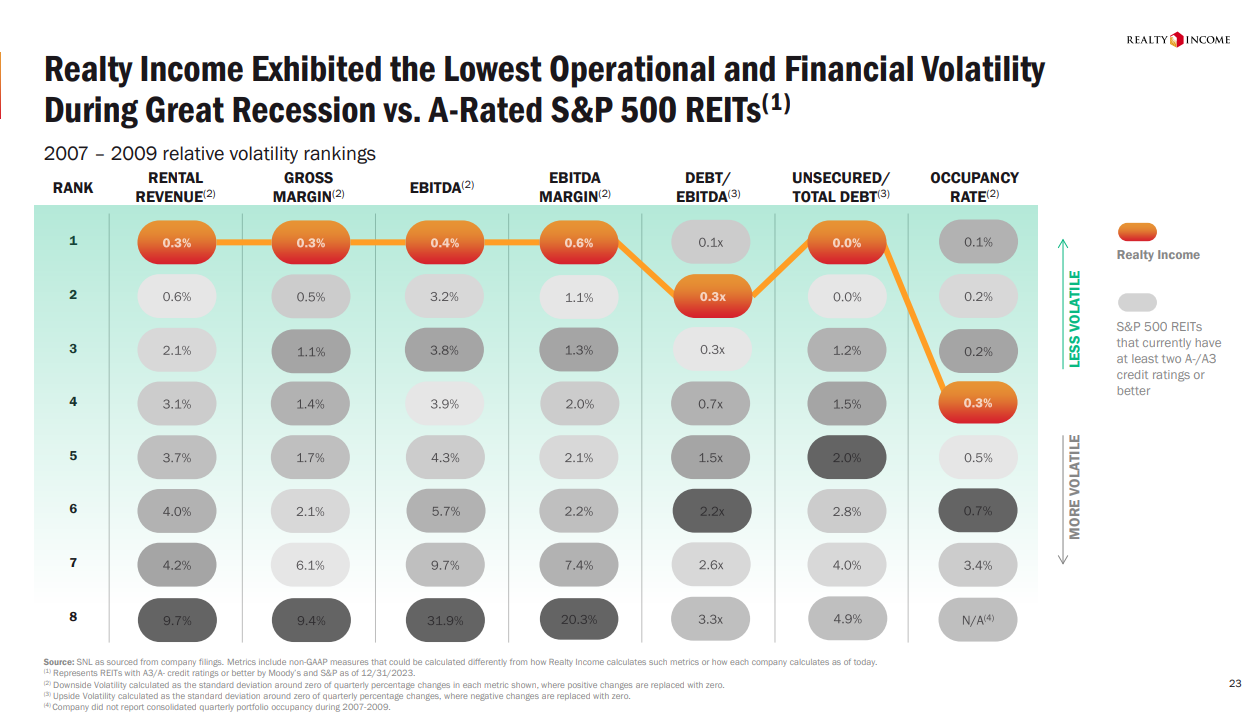
This consistency under pressure crystallizes in their Great Recession performance metrics:
Real quick...
Your market opportunity deserves an institutional-quality presentation. BetterPitch has created over 316 successful pitches across 17 industries, and we've earned a 96/100 client satisfaction rating along the way. Let us help you craft a pitch that captures your opportunity
Where other A-rated REITs experienced violent swings in financial performance, Realty Income's numbers tell a story of near-perfect stability.
Their rental revenue volatility registered at just 0.3% - less than half the next best performer's 0.6%.
EBITDA volatility painted an even starker picture at 0.4%, while their closest competitor clocked in at eight times that level.
Even EBITDA margins, typically the first metric to show stress, held steady with just 0.6% volatility against an industry struggling to maintain consistency.
The 2020 pandemic stress test only amplified these differentials:
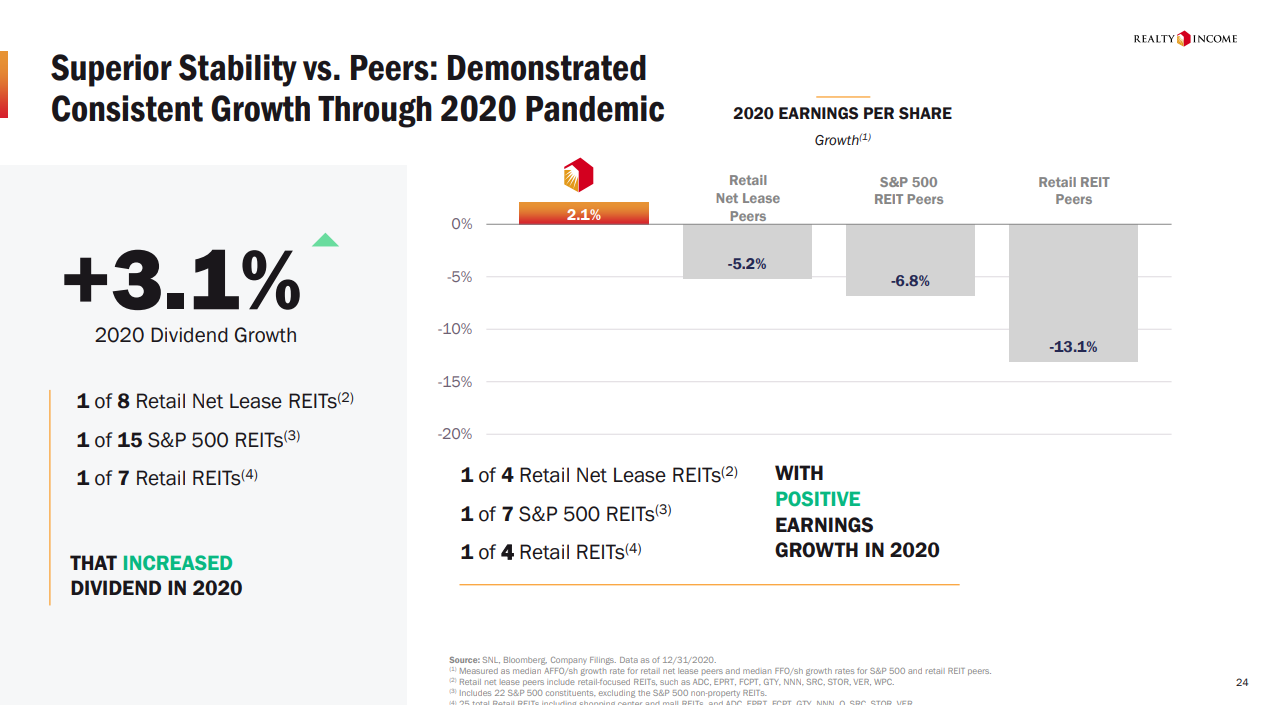
As retail REITs collectively posted 13.1% earnings declines and S&P 500 REITs suffered 6.8% drops, Realty Income charted a different course entirely.
Their 2.1% earnings growth during this period stands as testament to their operational model's resilience.
Among retail net lease REITs, they emerged as one of only four to maintain positive earnings momentum. In the broader S&P 500 REIT universe, they joined just seven peers in charting positive growth.
Moving forward, the Bellagio image introduces Realty Income's next chapter with architectural precision - both literal and financial:

Their balance sheet design mirrors the property's grandeur in its sophisticated construction.
A carefully orchestrated debt maturity ladder extends beyond 2034, creating strategic flexibility while maintaining iron-clad stability:
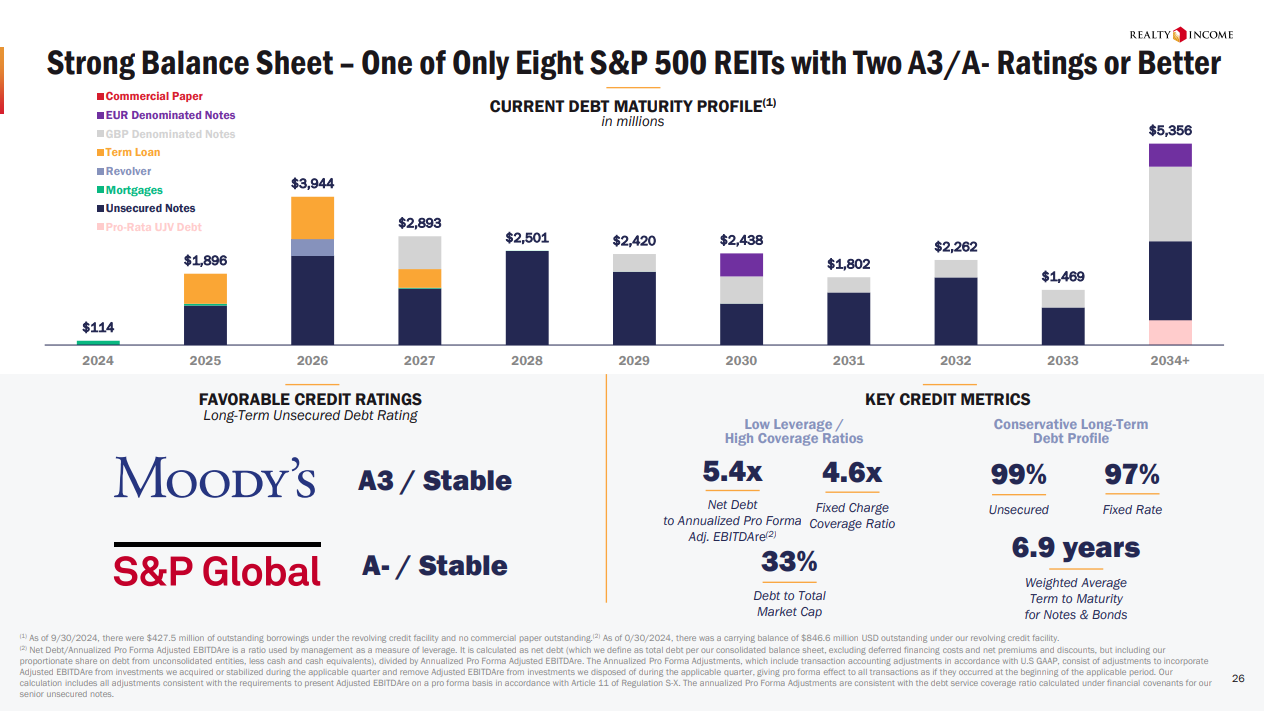
Their dual A3/A- credit ratings place them in rarefied air - among only eight S&P 500 REITs achieving this benchmark.
The metrics underlying these ratings reveal a financial architecture built for both defense and opportunity.
Net Debt to adjusted EBITDA sits at 5.4x, while fixed charge coverage holds strong at 4.6x.
The capital structure shows equal precision: 99% unsecured debt provides maximum flexibility, while 97% fixed rate exposure insulates against market volatility.
A 6.9-year weighted average maturity creates breathing room for strategic execution.
This conservative foundation translates into simple-to-grasp financial optionality.
And current liquidity of $5.2 billion stands ready against mere $2 billion in obligations through 2025:
Within this war chest, $3.8 billion in revolver availability combines with $958 million in ATM forwards and $397 million in cash.
The diamond gleam here is clear:
Zero commercial paper outstanding against $3 billion in program capacity - dry powder maintained without sacrificing an ounce of flexibility.
Now we move on to portfolio analysis, with the 7-Eleven property image introducing Realty Income's next strategic advantage - a portfolio engineered for stability through multiple layers of diversification:

But this isn't diversification for its own sake.
Each layer serves a specific purpose in constructing an institutional-grade income stream.
Their top 20 clients read like a who's who of retail stability - Dollar General at 3.3%, Walgreens at 3.3%, Family Dollar at 3.1%.
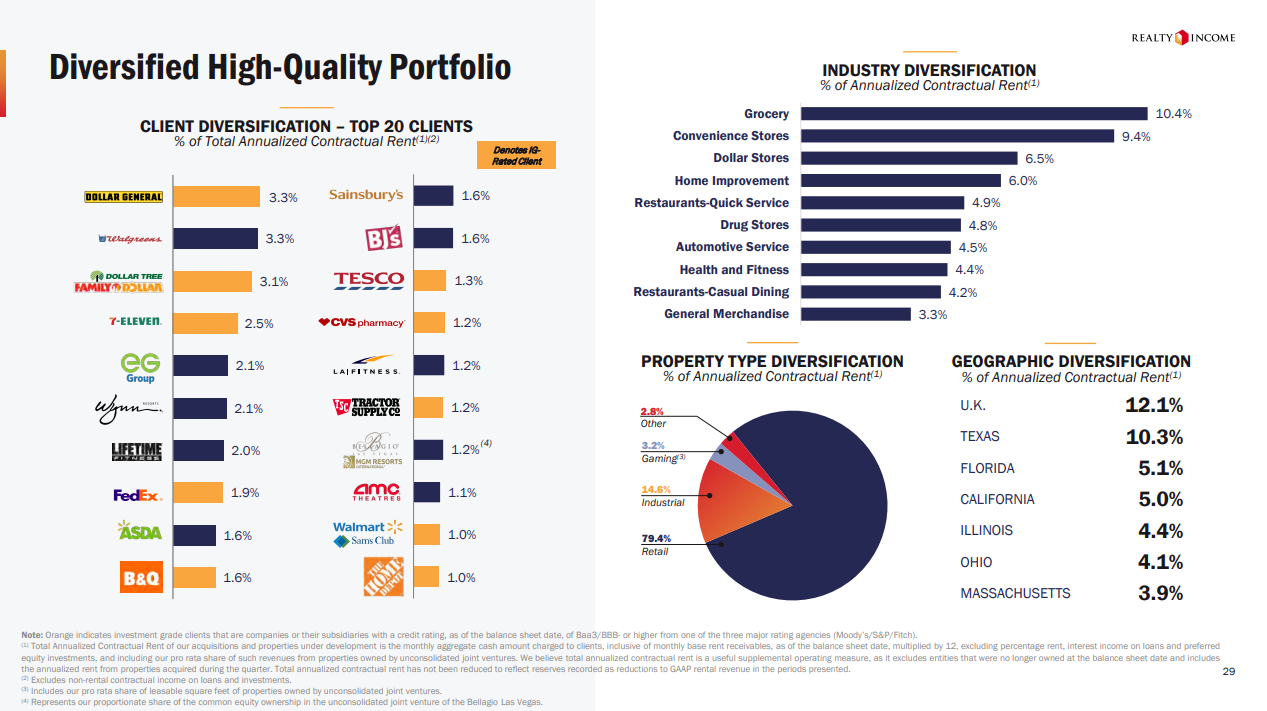
No single tenant exceeds 4% of rent, yet together these anchors provide a foundation of investment-grade credit.
The industry mix reinforces this stability:
Grocery leads at 10.4%, followed by convenience stores at 9.4%, and dollar stores at 6.5%.
Each sector chosen for its resistance to economic cycles and e-commerce disruption:
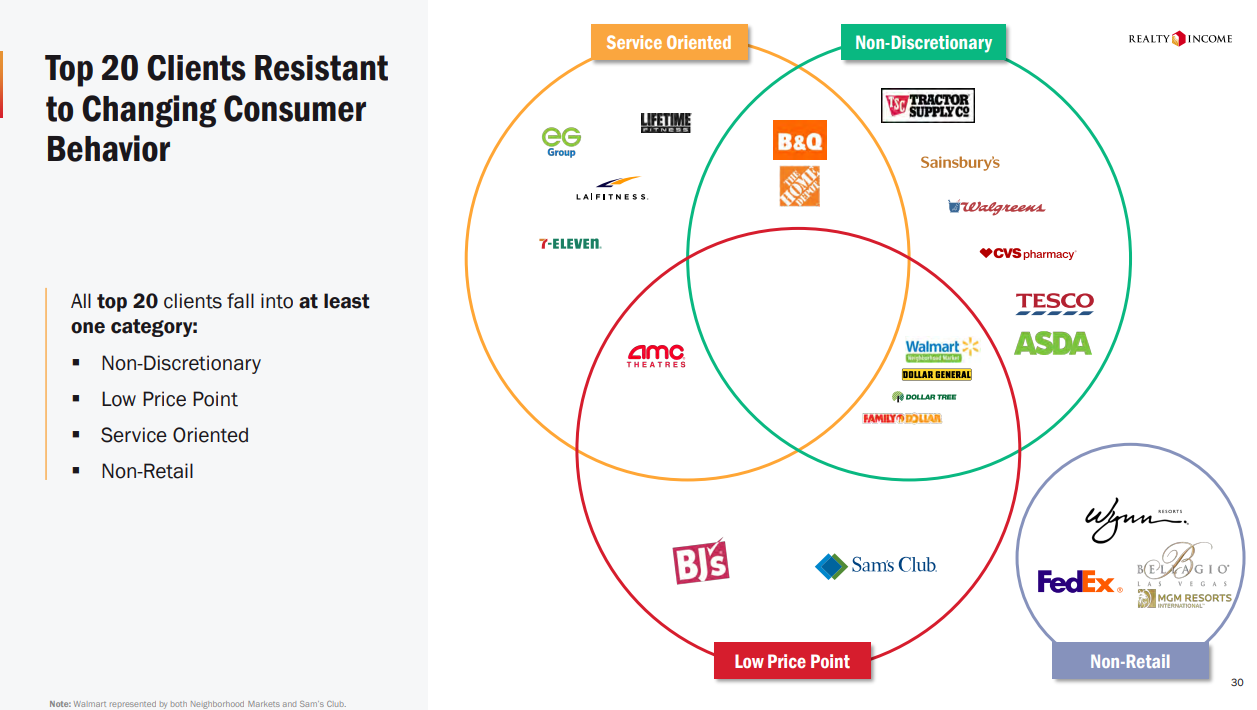
The Venn diagrams illustrate how every major tenant falls into at least one category designed for resilience: non-discretionary, service-oriented, low price point, or non-retail.
Take Walgreens - simultaneously non-discretionary and service-oriented.
Or Dollar General - combining low price points with non-discretionary goods.
This is a winning example of strategic redundancy.
Their platform stability is further reinforced in their occupancy numbers:
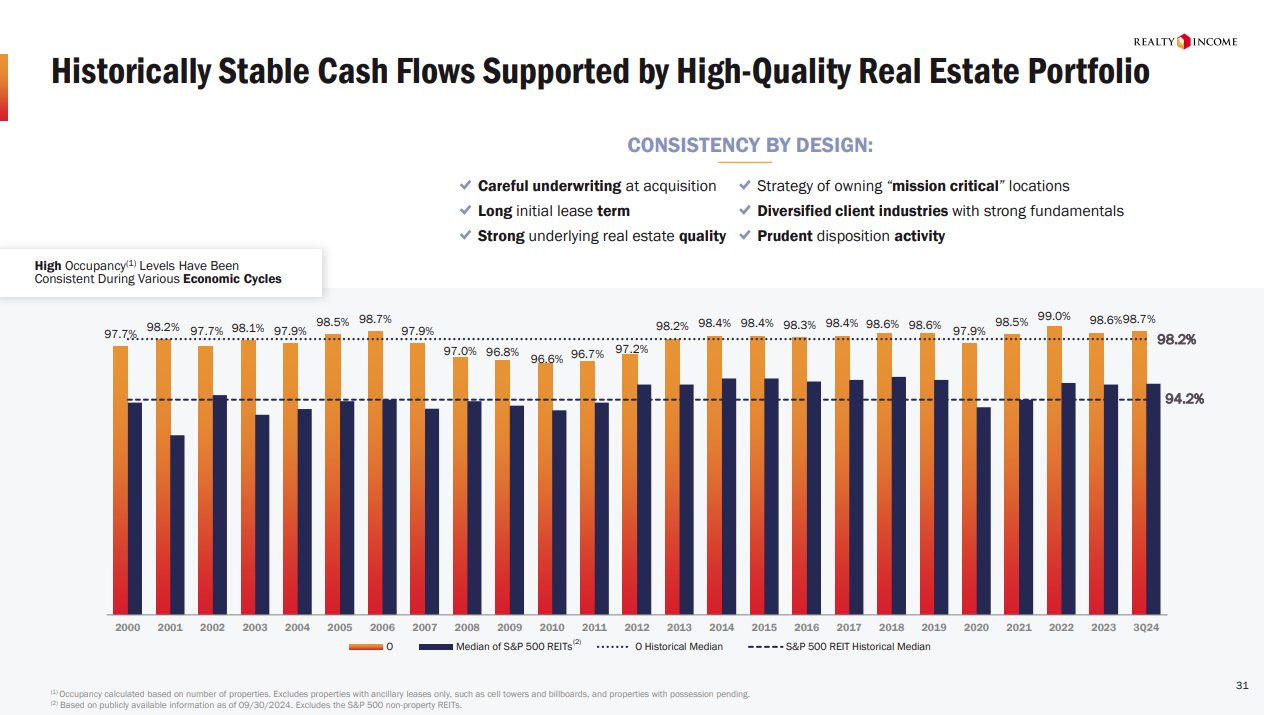
Over two decades, Realty Income's occupancy has never dipped below 96.6%.
Against S&P 500 REIT peers averaging 94.2%, this consistency speaks volumes about their tenant selection process.
Even through the depths of 2008 and 2020, the portfolio barely flinched.
And their asset management capabilities shine through the lease expiration schedule:
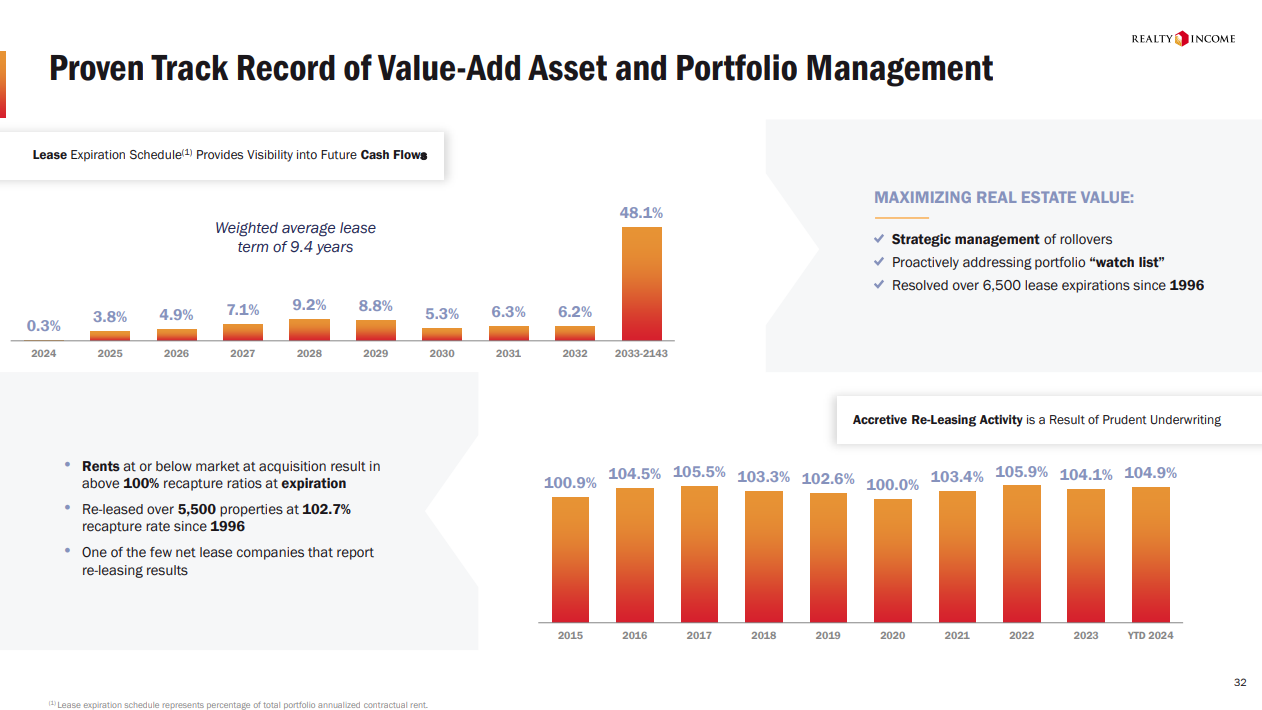
A weighted average term of 9.4 years provides visibility, while the staggered maturity pattern - never more than 9.2% in any year through 2032 - eliminates concentration risk.
More impressive:
They've maintained lease recapture rates above 100% for the past decade, peaking at 105.9% in 2022.
This disciplined approach to portfolio construction pays dividends in risk management, and they have evidence:
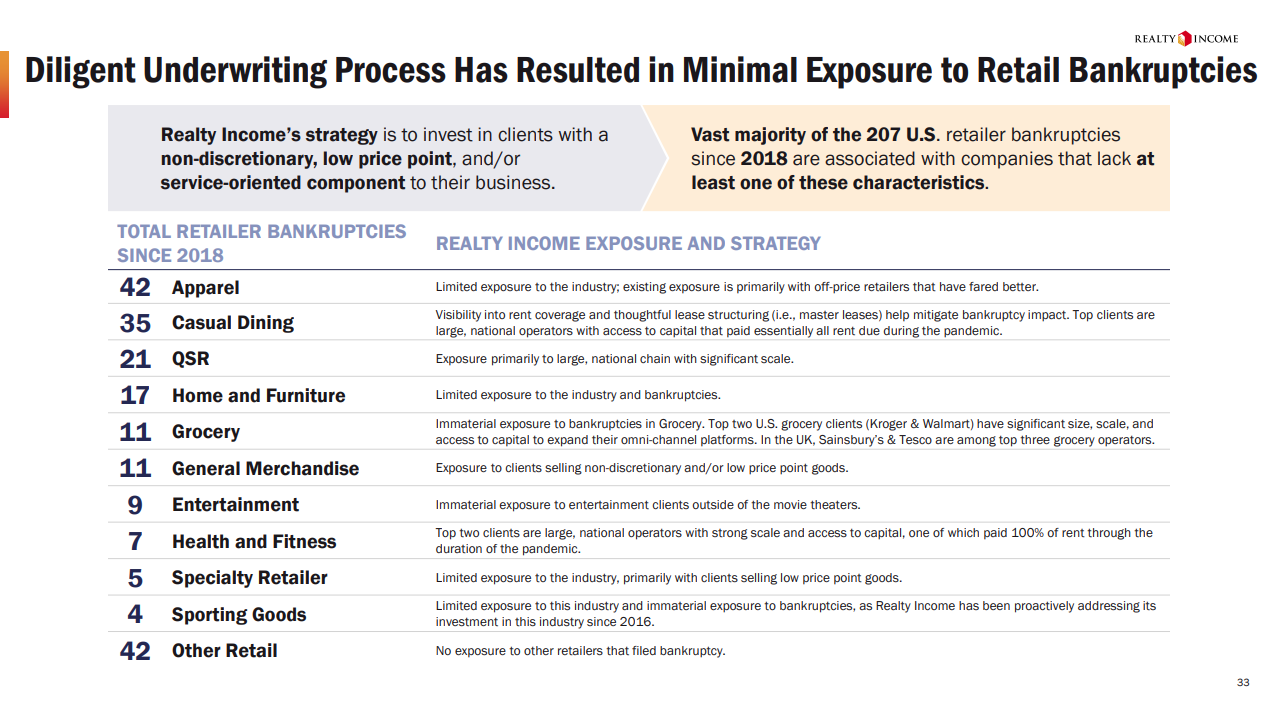
Among 207 U.S. retailer bankruptcies since 2018, Realty Income's exposure remains minimal.
Their strategy of focusing on non-discretionary, low price point, and service-oriented businesses has systematically screened out the most vulnerable retail segments.
While 42 apparel retailers filed bankruptcy, Realty Income's exposure centered on off-price operators - the segment's most resilient players.
Similarly, their casual dining exposure favored large national chains with strong balance sheets that maintained rent payments even through the pandemic.
The transition into portfolio quality metrics opens with stark evidence: bad debt as a percentage of total revenue tells a mathematical story of disciplined tenant selection.
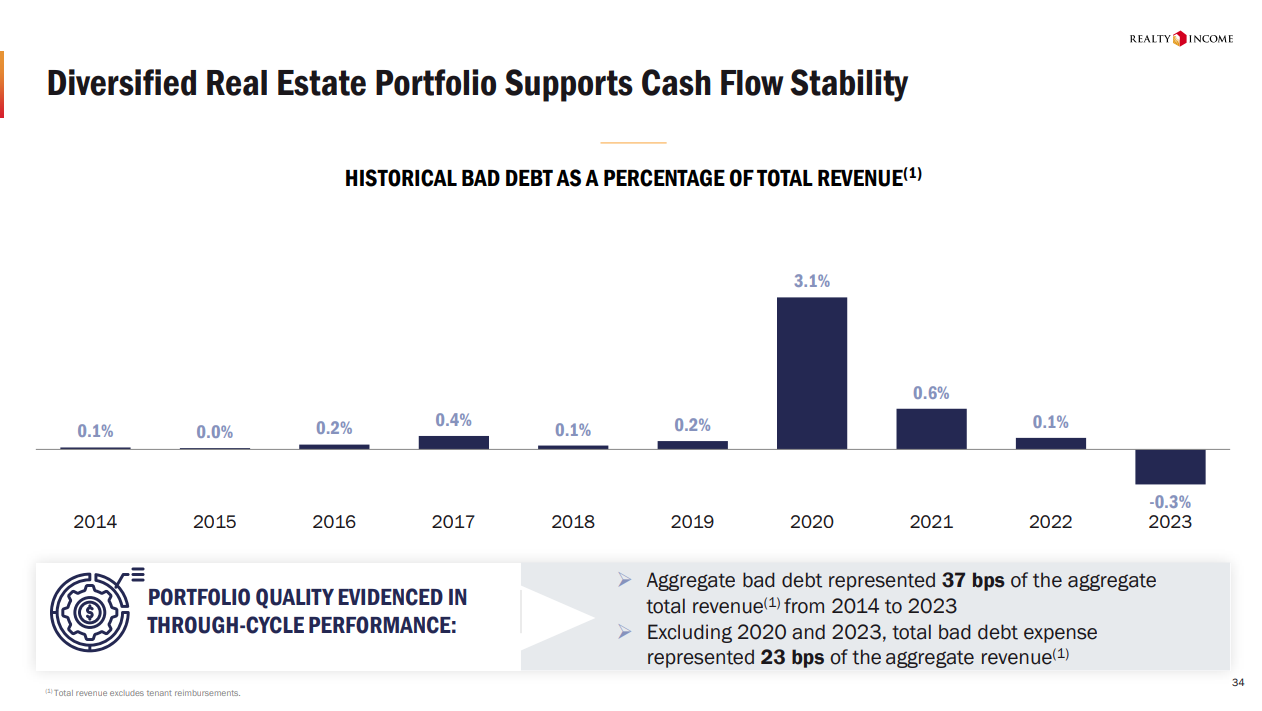
The numbers speak plainly - across a decade of operations, bad debt never exceeded 0.4% until 2020's pandemic spike to 3.1%.
Even then, the portfolio demonstrated remarkable elasticity, snapping back to pre-pandemic levels within 12 months.
For the next section, the Home Depot storefront introduces Realty Income's strategic advantage in tenant relationships.

Their cultivation of investment-grade corporate partnerships manifests in physical assets - each location representing a node in their nationwide network of mission-critical retail operations.
Then, the AFFO/sh metrics paint a portrait of sustained expansion across multiple economic cycles.
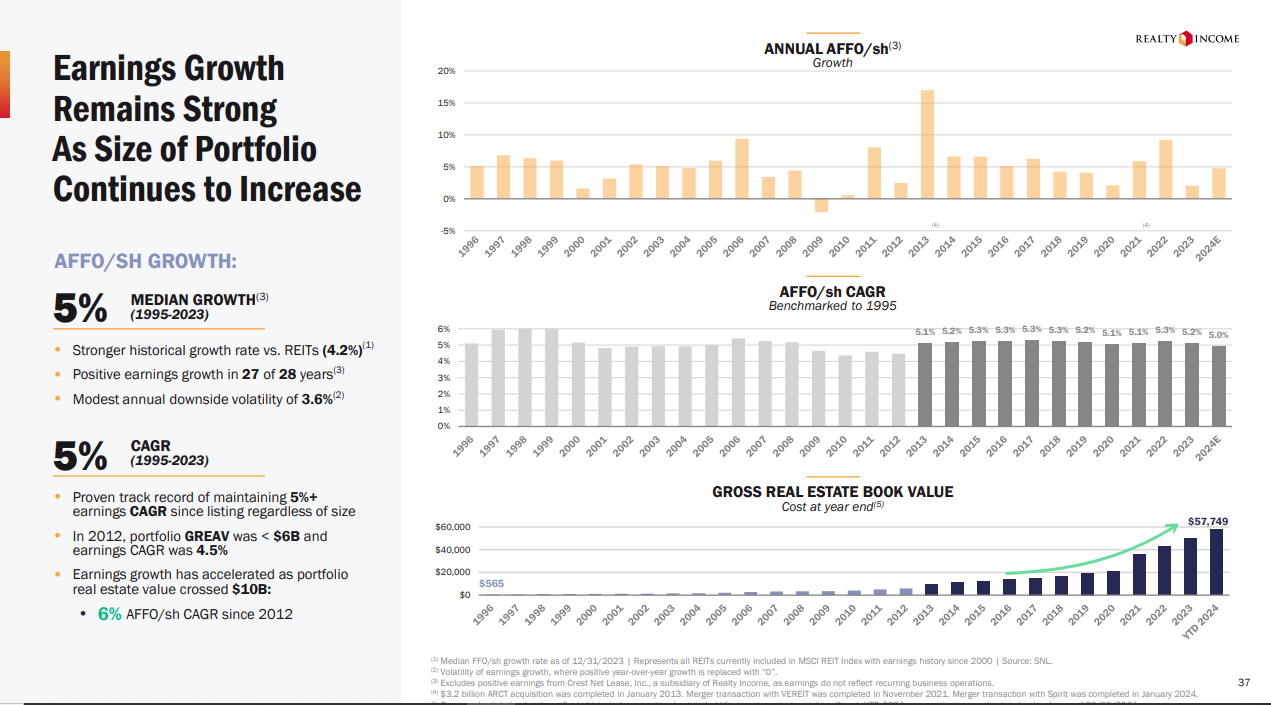
A 5% median growth rate since 1995 outpaces the broader REIT sector's 4.2%, while maintaining positive earnings growth in 27 of 28 years demonstrates the durability of their business model.
Two parallel narratives emerge in the CAGR visualization:
Short-term consistency: Annual volatility constrained to 3.6%
Long-term momentum: 5%+ earnings CAGR maintained regardless of portfolio size
The portfolio's evolution from $6B to $57.7B in gross real estate book value illuminates their scaling prowess.
When the portfolio crossed the $10B threshold, earnings growth accelerated to 6% AFFO/sh CAGR - empirical validation that their platform generates increasing returns to scale.
This combination of growth and stability transforms what might appear as conservative metrics into evidence of systematic value creation.
The progression through these metrics constructs a clear narrative:
Realty Income has engineered a platform that converts tenant relationships into durable cash flows, then deploys those cash flows to fuel additional growth - all while maintaining fortress-like portfolio stability.
They continue to prove this out here:
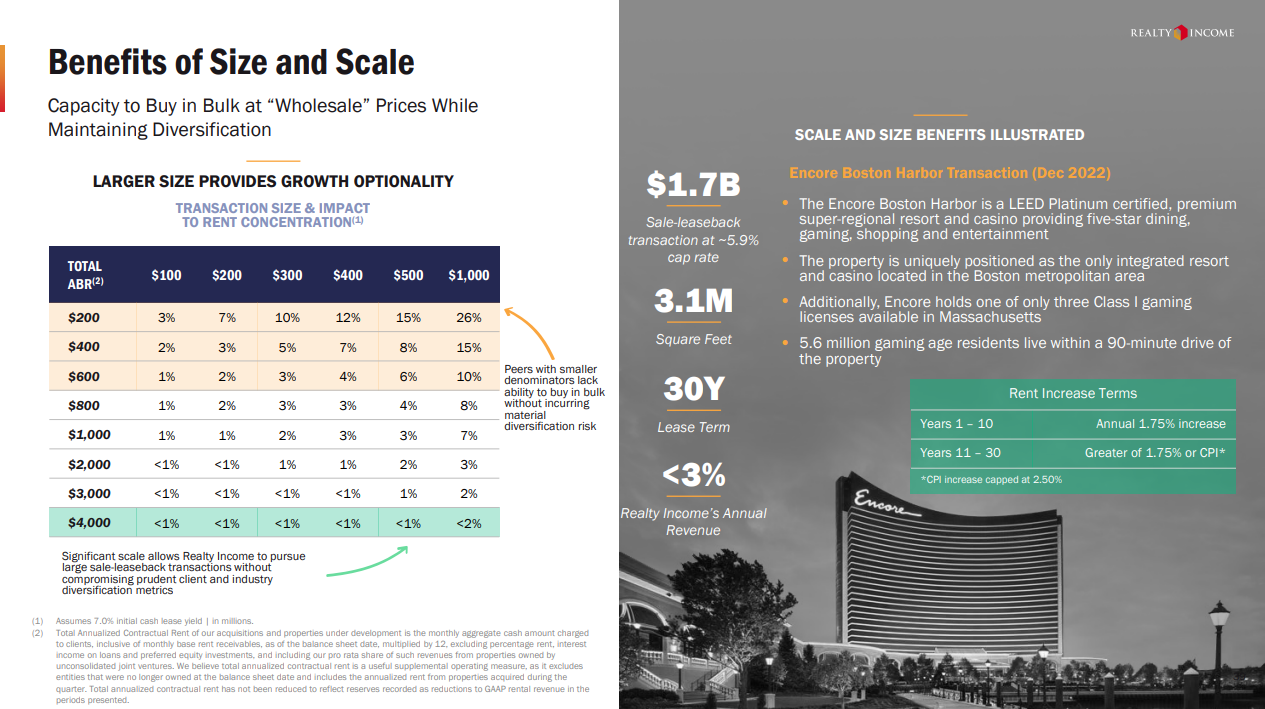
The matrix of transaction sizes reveals Realty Income's unique market position - their scale enables bulk acquisitions while maintaining portfolio diversity.
When deploying $1B in capital, they can capture a 26% share of available properties at the $200M level without overconcentration risk.
This mathematical advantage is irrefutable: larger transactions yield better pricing, which in turn fuels additional growth capacity.
The December 2022 Encore Boston Harbor transaction exemplifies their execution capabilities.
At $1.7B with a 5.9% cap rate, this LEED Platinum resort casino demonstrates their evolution into premium asset classes.
The transition to a data-driven investment approach manifests in their tenant selection - exemplified by partnerships with category leaders like Starbucks:

This systematic framework transforms raw market data into actionable intelligence, enabling precise asset selection across their 15,450+ property portfolio.
Next, we get data-rich visualization that serves dual purposes:
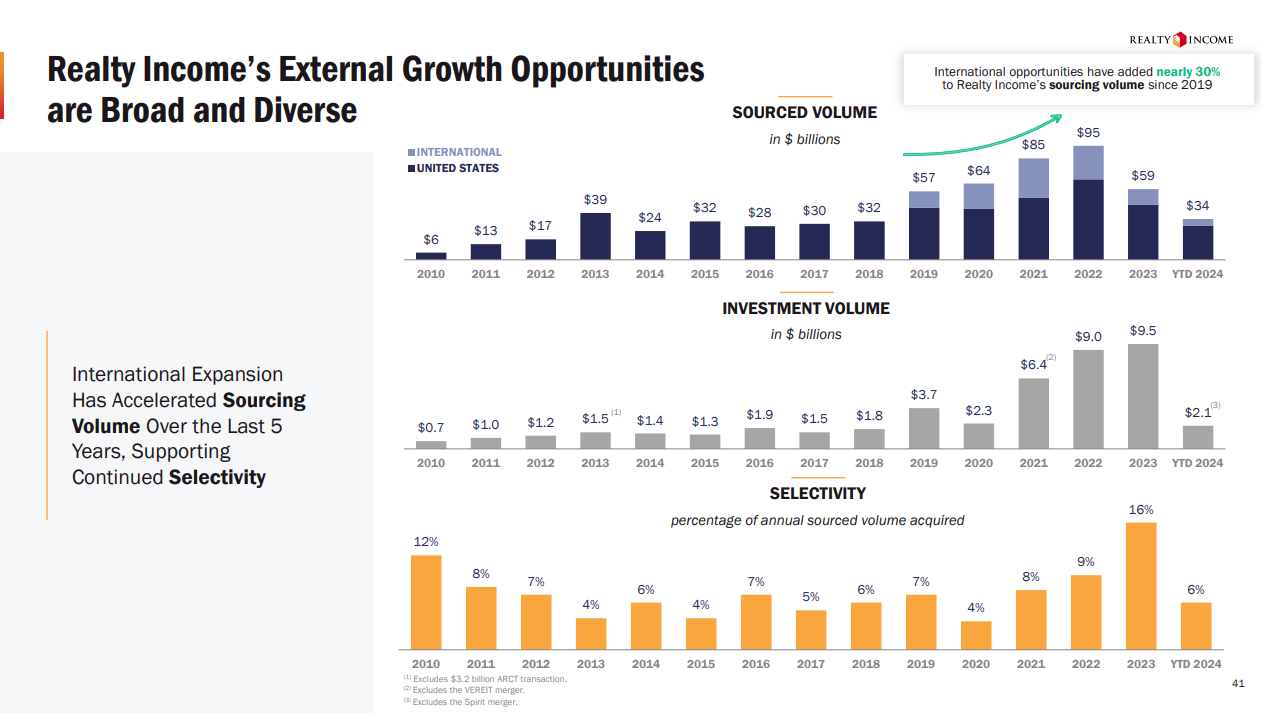
First, the ascending sourcing volume chart ($6B to $95B) establishes momentum.
Second, the selectivity metrics (ranging from 6-16%) counter any concerns about undisciplined growth.
This visual pairing carries a simple message - one where expansion coexists with prudent restraint.
By positioning the granular investment process diagram after the macro metrics, Realty preempts due diligence questions:
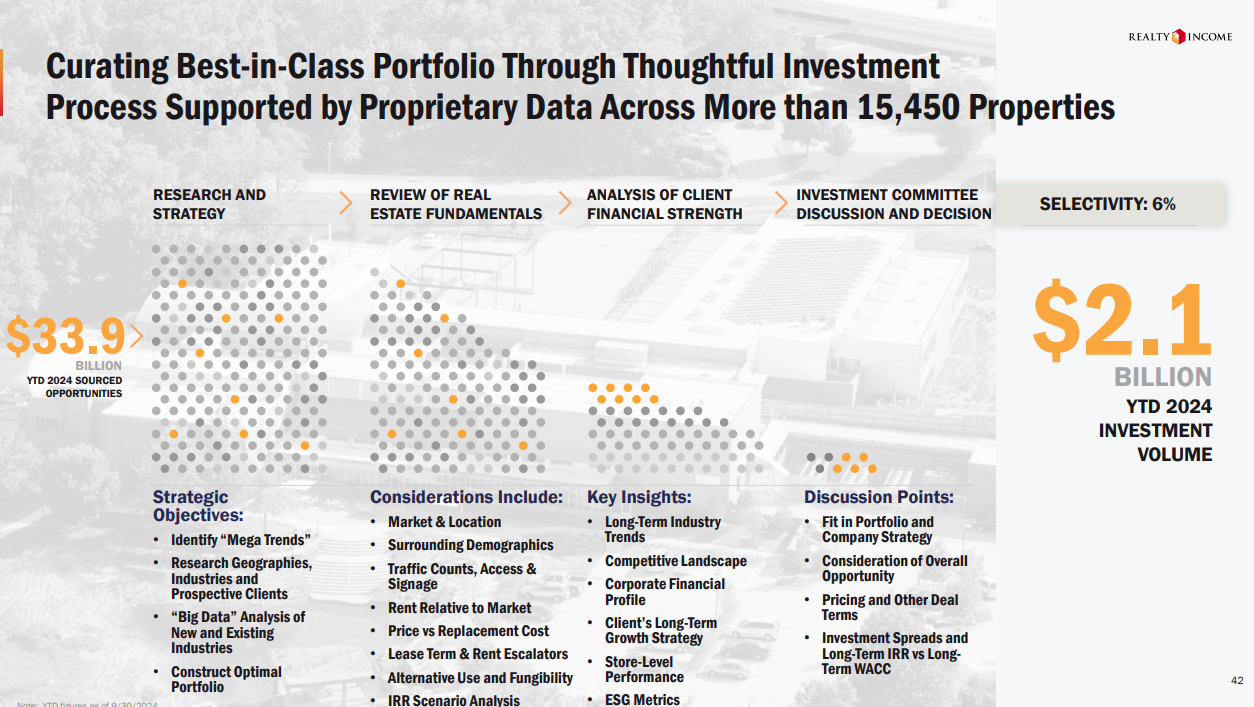
Each dot in the visualization represents a potential deal, with orange highlights marking successful acquisitions.
The decision to highlight their proprietary data advantage (15,450+ properties) anchors the entire growth discussion in concrete competitive advantages rather than mere market opportunity.
This positions Realty Income not just as a beneficiary of market trends, but as an architect of their own expansion trajectory.
Next, we see how their dual-track WACC analysis balances near-term earnings accretion against long-term value creation with impressive precision:
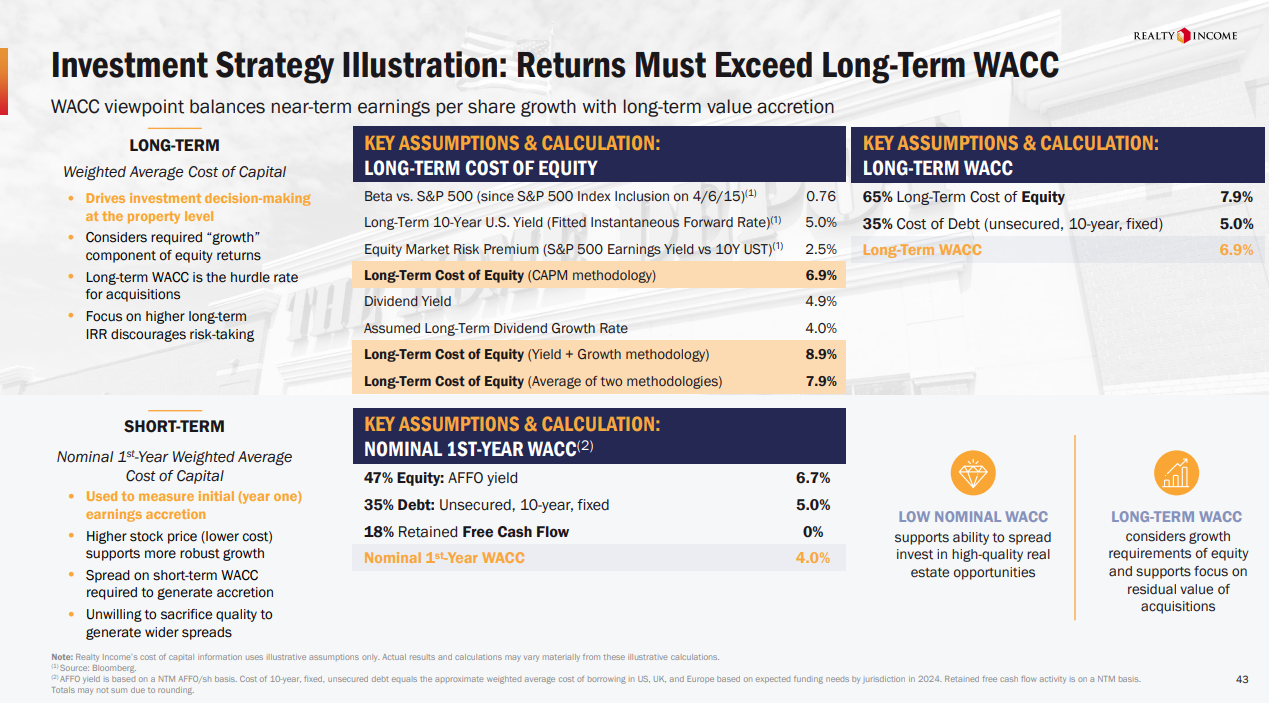
The long-term cost of equity calculation incorporates both CAPM methodology (6.9%) and yield-plus-growth analysis (8.9%), arriving at 7.9% through methodological triangulation.
This wasn't chosen by accident - it creates a hurdle rate high enough to ensure discipline while remaining achievable enough to enable growth.
The short-term framework demonstrates equal rigor.
The outlined spread allows Realty Income to pursue accretive acquisitions while maintaining investment discipline.
The retained free cash flow component sits at zero - not because they lack cash flow, but because they've engineered their capital structure to maximize reinvestment capacity.
This mathematical framework undergirds their European expansion strategy, which began with their 2019 Sainsbury's transaction.
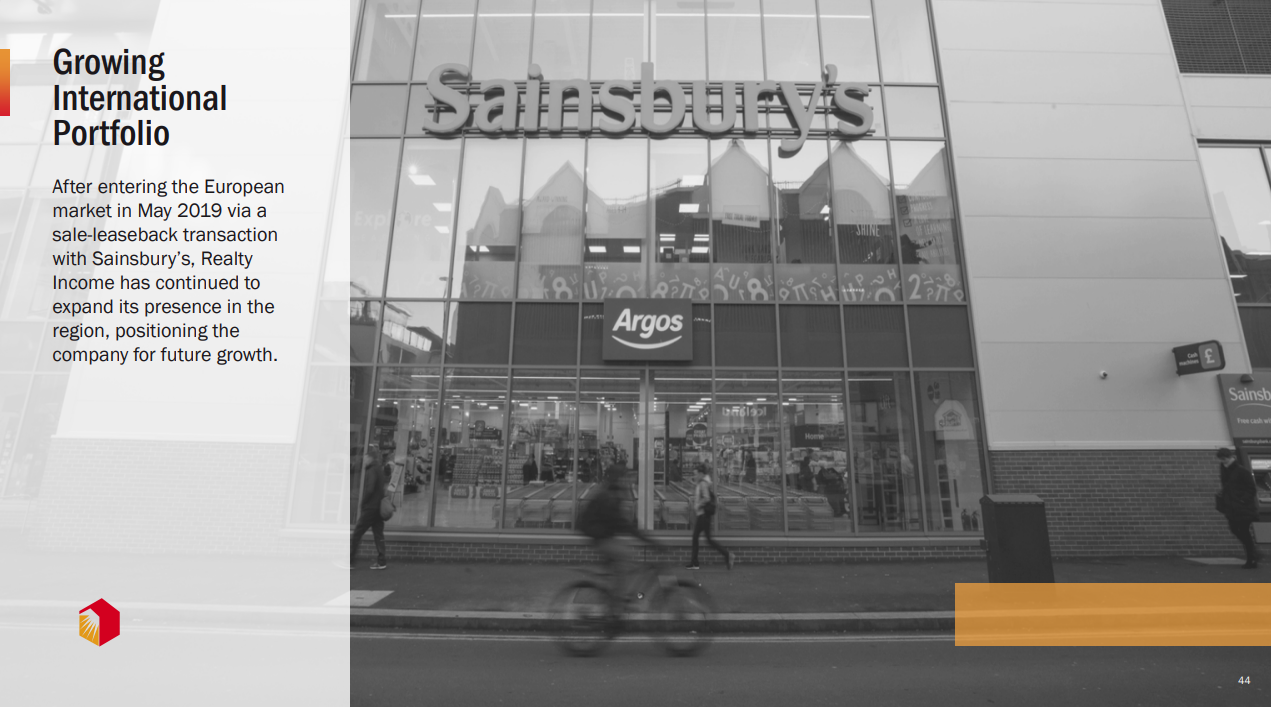
In just five years, they've built a €11.3 billion portfolio spanning 483 properties across 43 industries.
The growth trajectory speaks volumes:
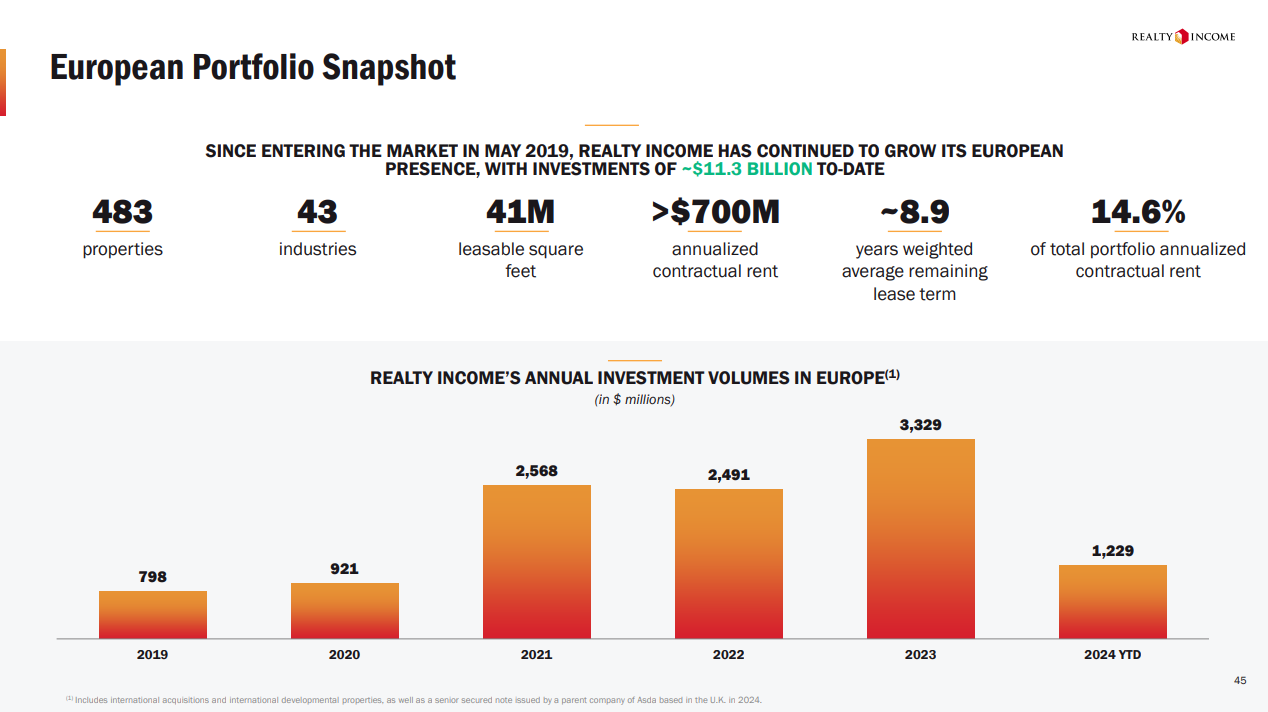
From €798 million deployed in 2019 to €3.3 billion in 2023. But the raw numbers only tell half the story.
The tenant mix once again cements positioning:
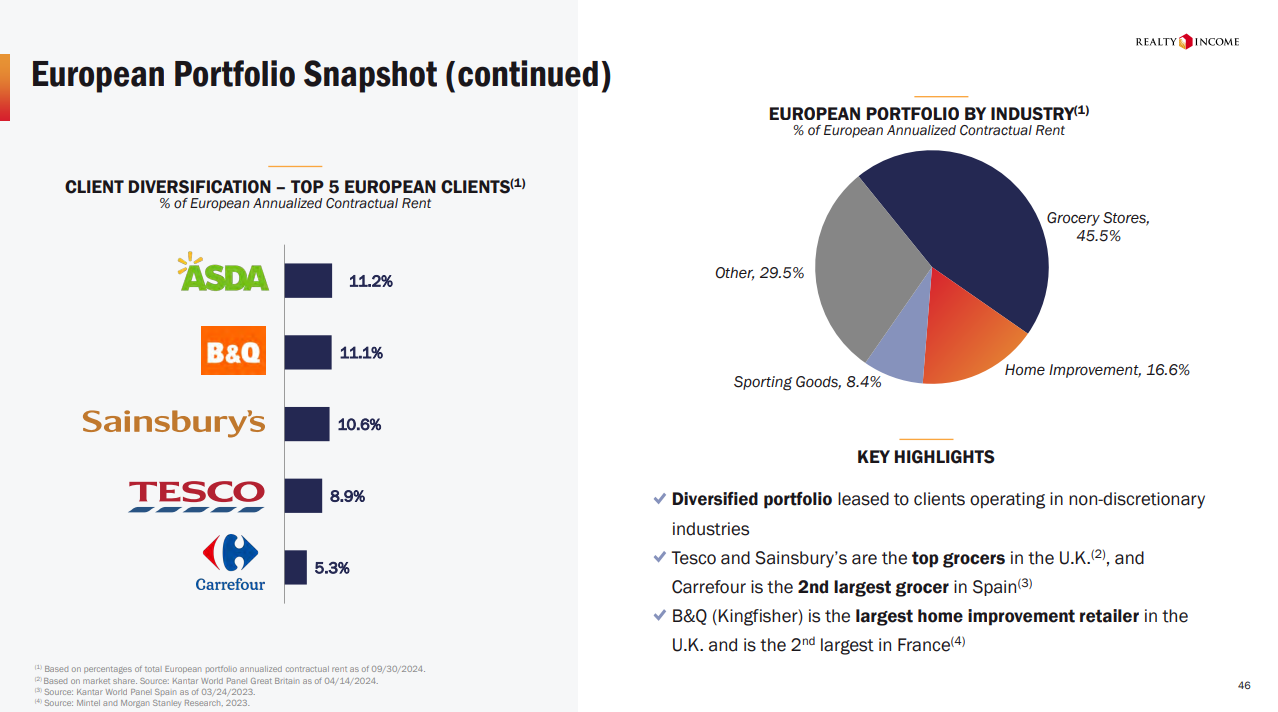
Grocery anchors the portfolio at 45.5% of rent, complemented by home improvement at 16.6% and sporting goods at 8.4%.
The top five tenants showcase the caliber: ASDA contributes 11.2%, B&Q adds 11.1%, and Sainsbury's provides 10.6%.
Each represents a market leader in their respective sector - ASDA and Sainsbury's dominate U.K. grocery, while B&Q leads home improvement across both Britain and France.
The Top Industry Investment Theses section returns to the CVS Pharmacy image:

Then, their grocery portfolio analysis showcases the same mathematical precision in market positioning we’ve seen throughout the deck:
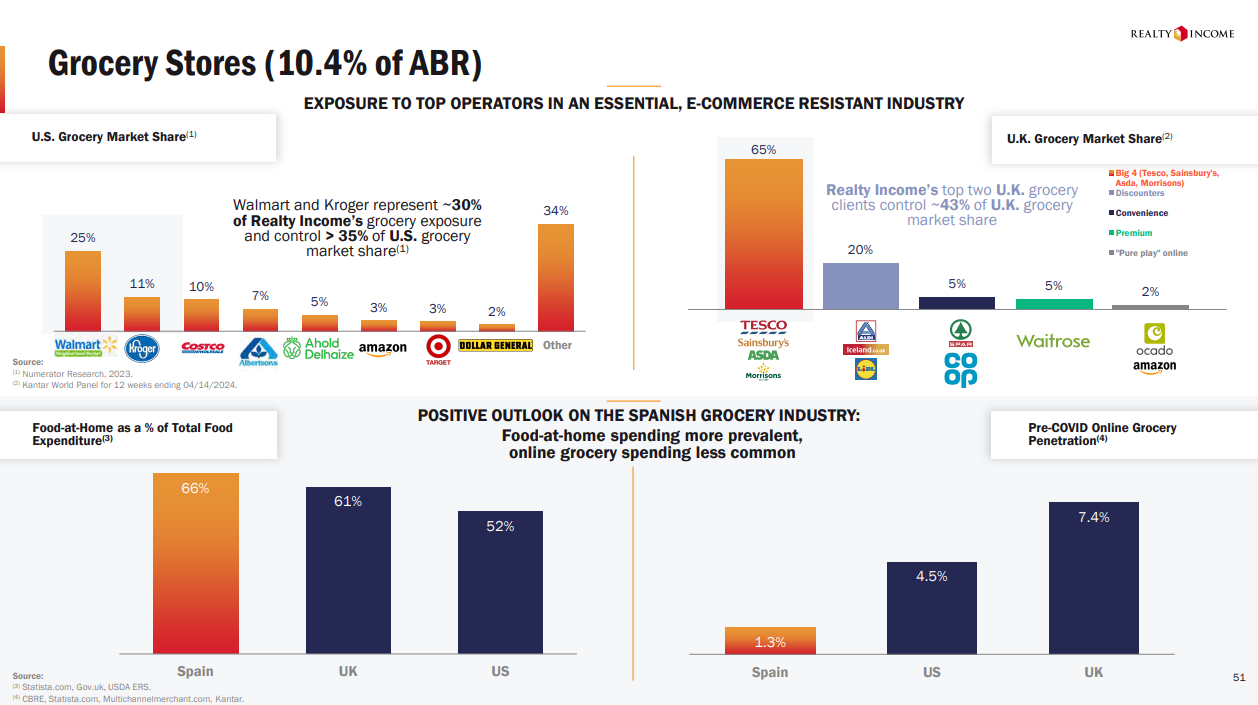
At 10.4% of annualized base rent, grocery investments represent calculated market penetration rather than speculative expansion.
The data validates this approach:
Walmart and Kroger command ~30% of Realty Income's grocery exposure while controlling ~35% of U.S. grocery market share - a ratio that speaks to systematic tenant selection.
The U.K. market analysis proves equally illuminating. Their top grocery clients control ~43% of U.K. market share, demonstrating cross-border replication of their U.S. strategy.
Moving to convenience stores (9.4% of ABR), Realty Income's analysis transcends surface-level metrics.
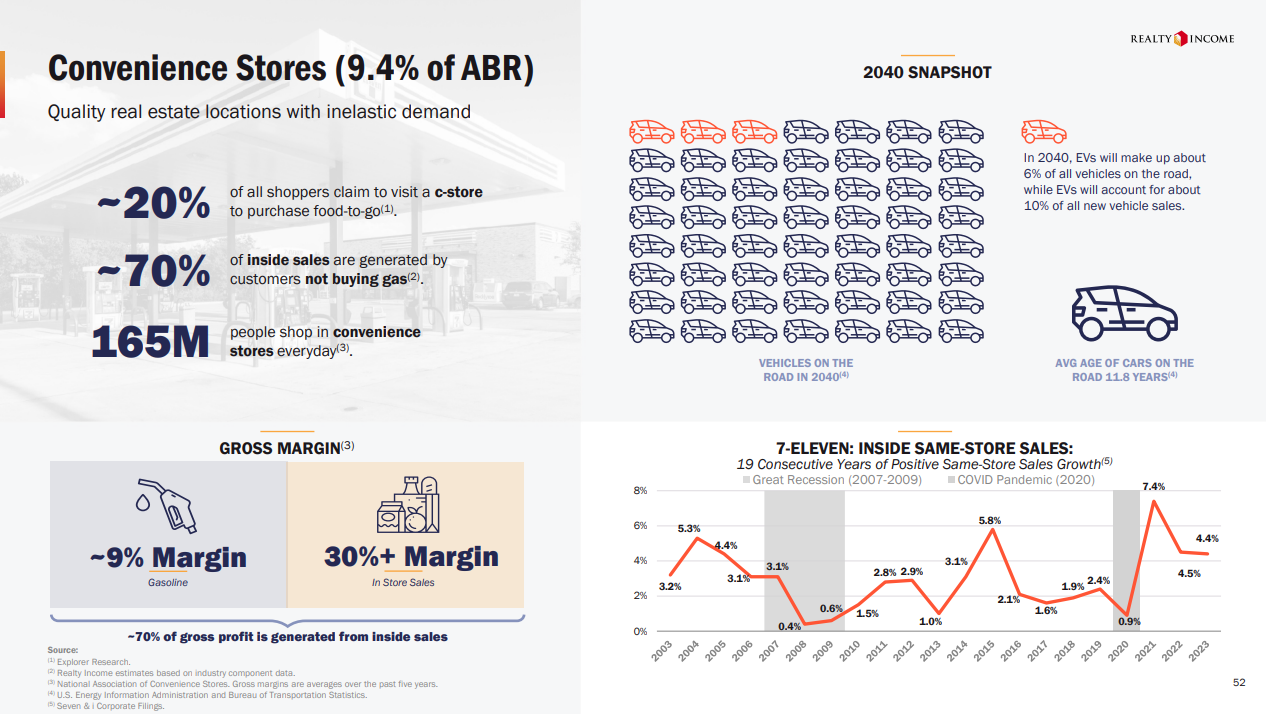
Their thesis rests on inelastic demand fundamentals:
20% of shoppers visit for food-to-go
70% of inside sales come from non-fuel customers
165M daily shoppers create consistent foot traffic
The 2040 snapshot reinforces their long-term thinking.
Even with EVs projected to reach 10% of new vehicle sales, the average vehicle age of 11.8 years ensures sustained demand for traditional fueling infrastructure.
This demographic moat protects against rapid disruption.
The convenience store economics are equally nuanced:
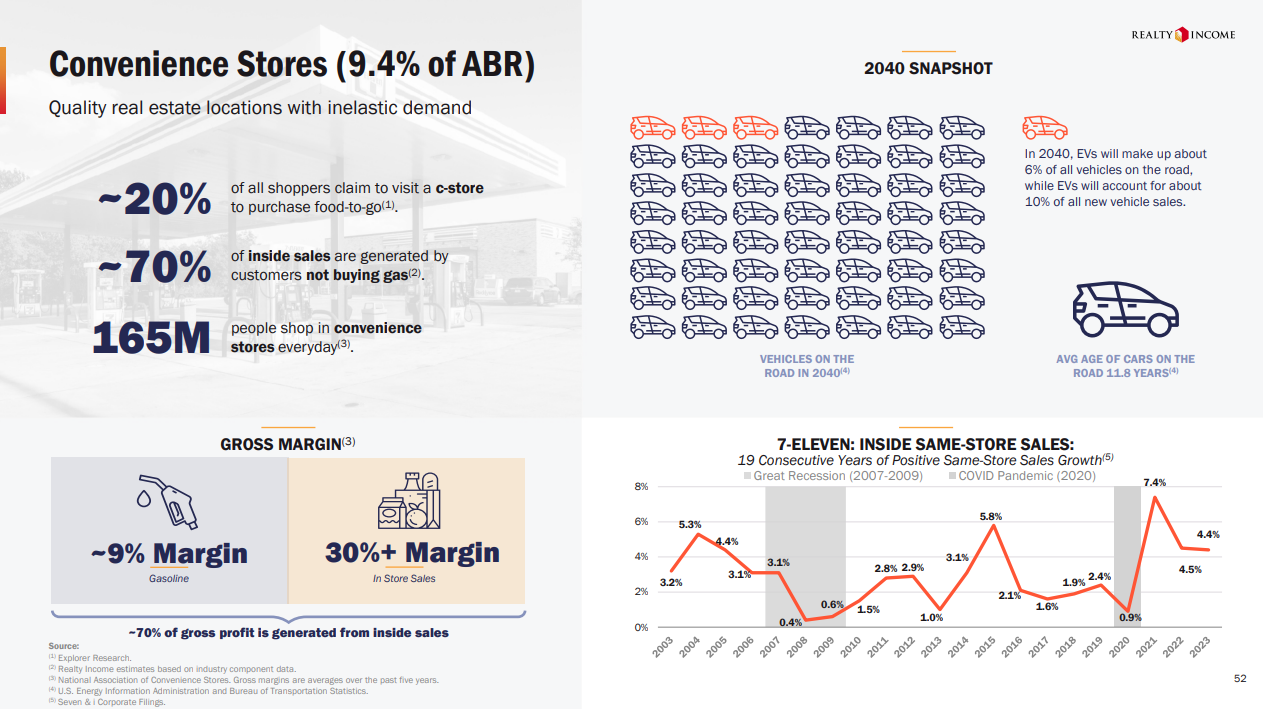
While fuel operates at ~9% margins, inside sales generate 30%+ margins.
With 70% of gross profit derived from inside sales, these properties generate stable cash flows regardless of energy market volatility.
7-Eleven's same-store sales trajectory validates this thesis.
Through both the Great Recession and COVID-19 pandemic, sales growth remained positive - concrete proof of recession resistance.
Dollar store investments (6.5% of ABR) demonstrate Realty Income's capacity to identify secular growth trends:
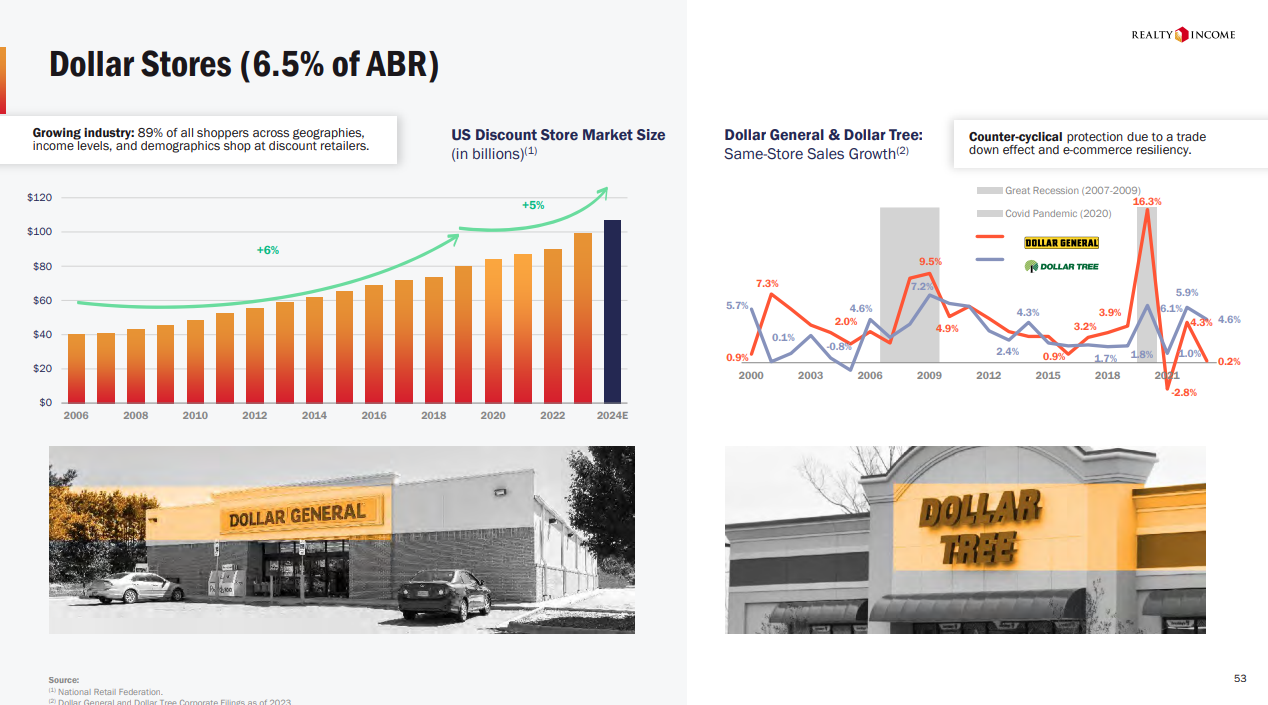
The U.S. discount store market's expansion from $40B in 2006 to over $100B in 2024E represents systematic market penetration rather than cyclical growth.
Dollar General and Dollar Tree's same-store sales performance - positive through both the 2008 financial crisis and 2020 pandemic - proves the countercyclical nature of their business model.
Home Improvement, just as earlier in the deck, reinforces a similar stability:
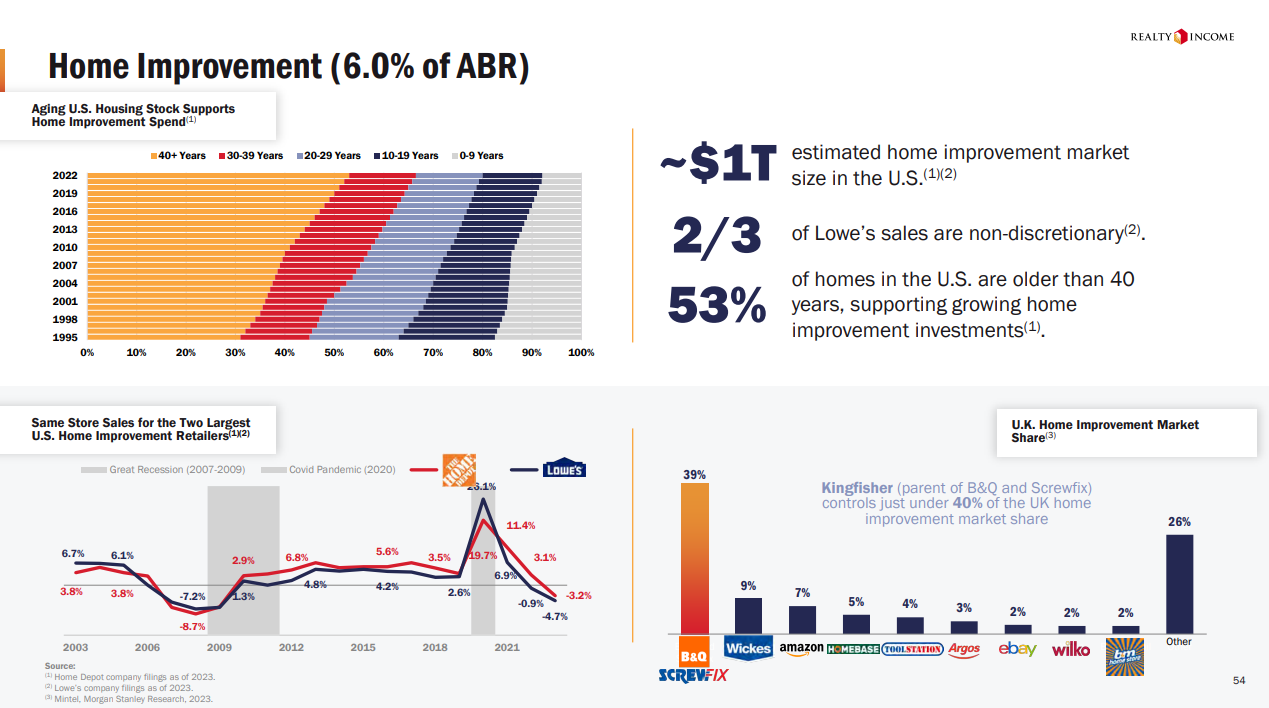
With 53% of U.S. homes over 40 years old, maintenance capital expenditure creates structural demand.
The $1T estimated market size combines with Lowe's 2/3 non-discretionary sales mix to generate recession-resistant cash flows.
Their U.K. home improvement strategy mirrors this approach.
Kingfisher's 40% market share through B&Q and Screwfix provides institutional-scale exposure to Britain's home improvement sector.
The fragmented nature of remaining market share (26% "Other") suggests consolidation opportunities.
Realty Income's pharmaceutical portfolio (4.8% of ABR) crystallizes their entire investment approach through the lens of healthcare real estate:
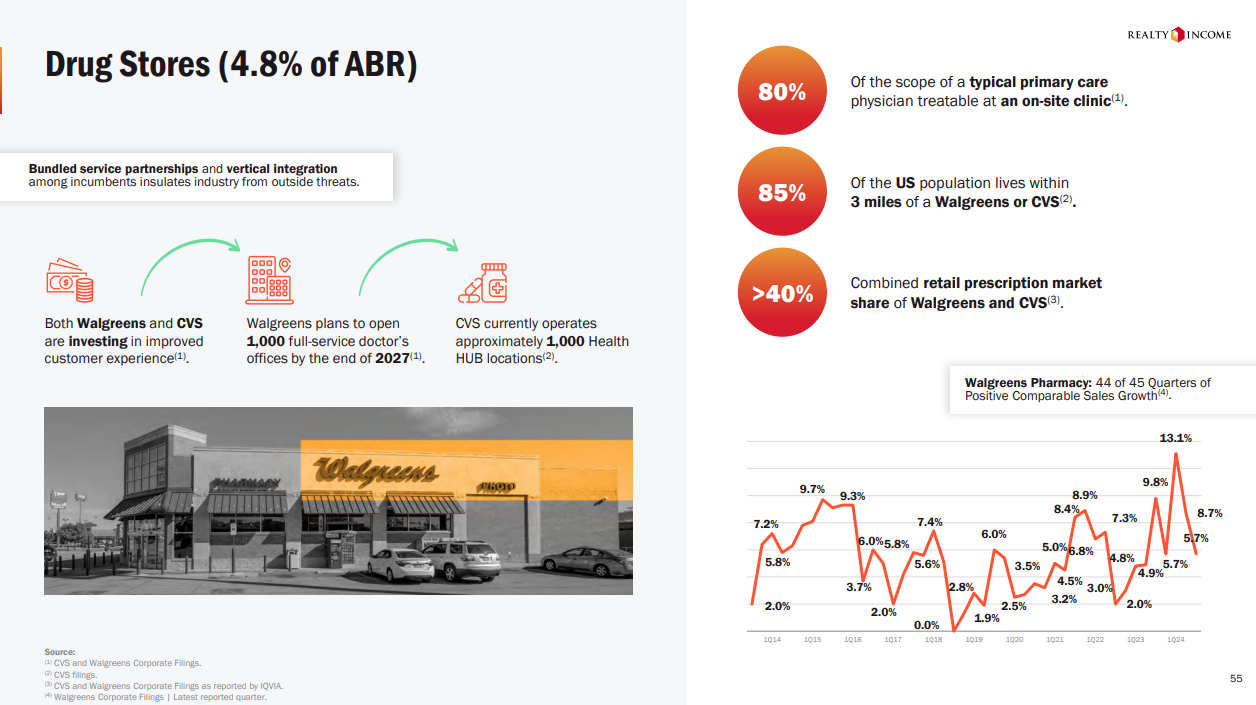
CVS and Walgreens exemplify the evolution from traditional retail to integrated healthcare delivery - each racing to open 1,000 full-service medical offices while simultaneously upgrading their customer experience infrastructure.
The statistics paint a picture of geometric expansion:
80% of primary care needs can be treated in these locations, while 85% of Americans already live within three miles of these providers.
Their combined 40%+ retail prescription market share transforms simple retail locations into essential healthcare infrastructure.
Why This Presentation Transcends Traditional REIT Positioning
Realty Income's November 2024 presentation manages to take what could have been a straightforward net lease story into an incredibly thoughtful clinic in institutional positioning.
The $83 billion enterprise value and $58 billion portfolio might have carried the narrative alone…
But they opted for precise, mathematical persuasion over market dominance.
Their presentation architecture dismantles traditional REIT investment concerns with surgical precision:
Geographic concentration? Here's the systematic expansion from U.S. to Europe.
Retail exposure? Here's the data proving recession resistance across cycles.
Interest rate sensitivity? Here's 55 years of performance across rate environments.
Each sector analysis builds its own mathematical fortress:
Grocery: Market leaders controlling 35% share
Convenience: 70% profits from non-fuel sales
Dollar stores: Positive growth through multiple recessions
Home improvement: 53% of U.S. homes over 40 years old
Drug stores: 85% population coverage within three miles
Then, the European expansion narrative exemplifies their analytical depth.
Rather than chasing yield abroad, they identified markets where public REITs account for less than 0.1% of the addressable $8.5 trillion opportunity.
Their €11.3 billion portfolio across eight countries emerged from strategic precision rather than geographic ambition.
Their three-pillar approach to risk management - tenant quality, property selection, and structural protection - reads less like a strategy and more like a scientific analysis – in the best way possible.
The 98.7% occupancy rate and 105% lease renewal spreads serve as empirical validation.
By the final slides, Realty Income accomplishes something beyond mere market leadership - they establish themselves as architects of modern retail real estate infrastructure.
For institutional investors seeking to deploy capital across retail sectors while maintaining ironclad discipline, Realty Income's platform stands alone.
Through methodical analysis and strategic execution, Realty Income has built more than a real estate portfolio - they've created the definitive institutional platform for capturing retail's next chapter.
Real quick...
Does your pitch tell a story as compelling as Realty Income's? BetterPitch specializes in creating investment materials that resonate with institutional investors. From market analysis to strategy presentation, we help managers build world-class marketing collateral to raise capital more efficiently.
See you next friday,
What do you think?Give us feedback! |
Reading this and not subscribed?